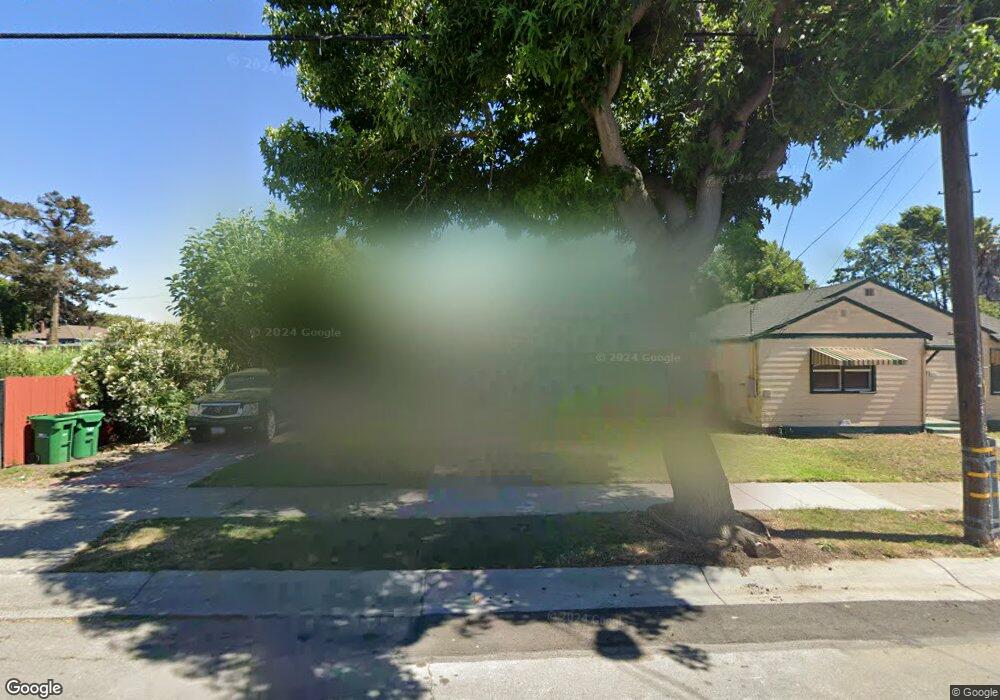
948 91st Ave Oakland, CA 94603
Highland NeighborhoodEstimated Value: $480,000 - $563,982
3
Beds
1
Bath
1,147
Sq Ft
$453/Sq Ft
Est. Value
About This Home
This home is located at 948 91st Ave, Oakland, CA 94603 and is currently estimated at $519,996, approximately $453 per square foot. 948 91st Ave is a home located in Alameda County with nearby schools including New Highland Academy, Acorn Woodland Elementary School, and Encompass Academy Elementary.
Ownership History
Date
Name
Owned For
Owner Type
Purchase Details
Closed on
Sep 23, 2005
Sold by
Dumas Ronald W
Bought by
Dumas Colette
Current Estimated Value
Home Financials for this Owner
Home Financials are based on the most recent Mortgage that was taken out on this home.
Original Mortgage
$250,000
Outstanding Balance
$144,623
Interest Rate
7.17%
Mortgage Type
Fannie Mae Freddie Mac
Estimated Equity
$375,373
Purchase Details
Closed on
Apr 18, 1996
Sold by
Swanson Carolyn and Swanson Janie M
Bought by
Dumas Ronald W
Home Financials for this Owner
Home Financials are based on the most recent Mortgage that was taken out on this home.
Original Mortgage
$69,700
Interest Rate
7.84%
Mortgage Type
FHA
Create a Home Valuation Report for This Property
The Home Valuation Report is an in-depth analysis detailing your home's value as well as a comparison with similar homes in the area
Home Values in the Area
Average Home Value in this Area
Purchase History
| Date | Buyer | Sale Price | Title Company |
|---|---|---|---|
| Dumas Colette | $390,000 | First American Title Co | |
| Dumas Ronald W | $71,000 | First American Title Guarant |
Source: Public Records
Mortgage History
| Date | Status | Borrower | Loan Amount |
|---|---|---|---|
| Open | Dumas Colette | $250,000 | |
| Previous Owner | Dumas Ronald W | $69,700 |
Source: Public Records
Tax History
| Year | Tax Paid | Tax Assessment Tax Assessment Total Assessment is a certain percentage of the fair market value that is determined by local assessors to be the total taxable value of land and additions on the property. | Land | Improvement |
|---|---|---|---|---|
| 2025 | $9,729 | $525,918 | $159,875 | $373,043 |
| 2024 | $9,729 | $515,470 | $156,741 | $365,729 |
| 2023 | $10,061 | $512,228 | $153,668 | $358,560 |
| 2022 | $10,181 | $495,187 | $150,656 | $351,531 |
| 2021 | $9,865 | $485,343 | $147,703 | $344,640 |
| 2020 | $9,737 | $487,297 | $146,189 | $341,108 |
| 2019 | $7,956 | $390,000 | $117,000 | $273,000 |
| 2018 | $7,326 | $350,000 | $105,000 | $245,000 |
| 2017 | $6,457 | $315,000 | $94,500 | $220,500 |
| 2016 | $5,119 | $245,000 | $73,500 | $171,500 |
| 2015 | $5,053 | $225,000 | $67,500 | $157,500 |
| 2014 | $4,343 | $175,000 | $52,500 | $122,500 |
Source: Public Records
Map
Nearby Homes
Your Personal Tour Guide
Ask me questions while you tour the home.