948 Candlestar Loop N Fountain, CO 80817
Central Fountain Valley NeighborhoodEstimated Value: $309,000 - $346,000
3
Beds
2
Baths
1,188
Sq Ft
$280/Sq Ft
Est. Value
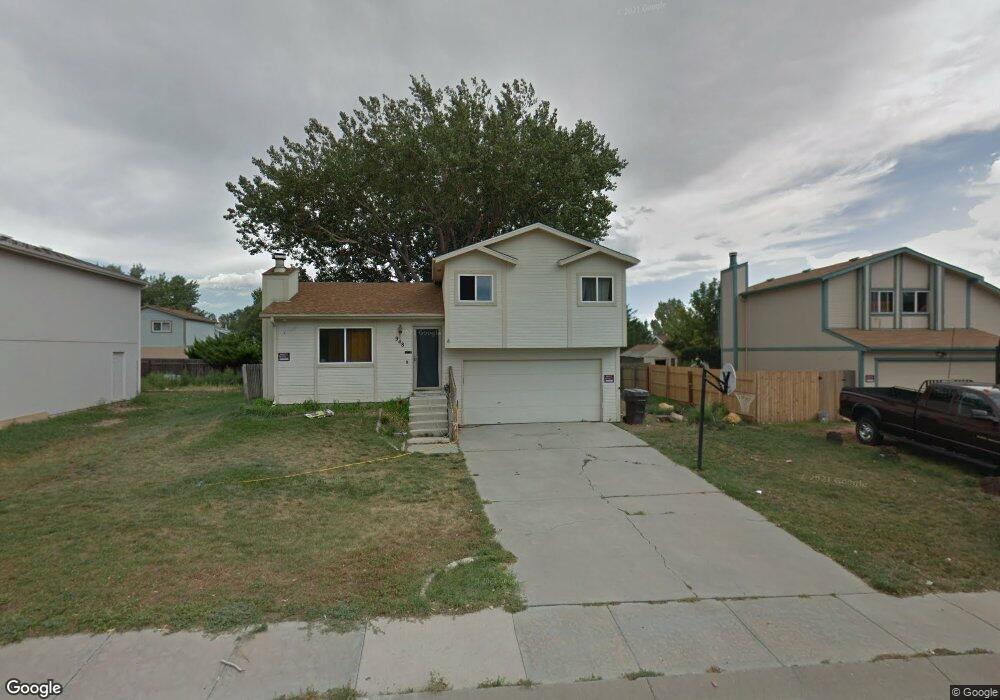
About This Home
This home is located at 948 Candlestar Loop N, Fountain, CO 80817 and is currently estimated at $333,087, approximately $280 per square foot. 948 Candlestar Loop N is a home located in El Paso County with nearby schools including Jordahl Elementary School, Fountain Middle School, and Fountain-Fort Carson High School.
Ownership History
Date
Name
Owned For
Owner Type
Purchase Details
Closed on
Oct 15, 2003
Sold by
Coulter Georgia M
Bought by
Hayes Maryellen E
Current Estimated Value
Home Financials for this Owner
Home Financials are based on the most recent Mortgage that was taken out on this home.
Original Mortgage
$121,038
Outstanding Balance
$57,296
Interest Rate
6.42%
Mortgage Type
FHA
Estimated Equity
$275,791
Purchase Details
Closed on
Jul 2, 1999
Sold by
Coulter Gerald T and Coulter Georgia M
Bought by
Coulter Georgia M
Home Financials for this Owner
Home Financials are based on the most recent Mortgage that was taken out on this home.
Original Mortgage
$81,500
Interest Rate
9%
Purchase Details
Closed on
Oct 11, 1988
Bought by
Hayes Maryellen E
Purchase Details
Closed on
Jul 1, 1986
Bought by
Hayes Maryellen E
Create a Home Valuation Report for This Property
The Home Valuation Report is an in-depth analysis detailing your home's value as well as a comparison with similar homes in the area
Home Values in the Area
Average Home Value in this Area
Purchase History
| Date | Buyer | Sale Price | Title Company |
|---|---|---|---|
| Hayes Maryellen E | $130,000 | -- | |
| Coulter Georgia M | -- | -- | |
| Hayes Maryellen E | -- | -- | |
| Hayes Maryellen E | -- | -- |
Source: Public Records
Mortgage History
| Date | Status | Borrower | Loan Amount |
|---|---|---|---|
| Open | Hayes Maryellen E | $121,038 | |
| Previous Owner | Coulter Georgia M | $81,500 | |
| Closed | Hayes Maryellen E | $10,000 |
Source: Public Records
Tax History
| Year | Tax Paid | Tax Assessment Tax Assessment Total Assessment is a certain percentage of the fair market value that is determined by local assessors to be the total taxable value of land and additions on the property. | Land | Improvement |
|---|---|---|---|---|
| 2025 | $1,272 | $23,880 | -- | -- |
| 2024 | $1,122 | $24,850 | $5,180 | $19,670 |
| 2022 | $950 | $16,290 | $3,580 | $12,710 |
| 2021 | $883 | $16,760 | $3,680 | $13,080 |
| 2020 | $669 | $12,430 | $3,220 | $9,210 |
| 2019 | $656 | $12,430 | $3,220 | $9,210 |
| 2018 | $558 | $10,210 | $2,340 | $7,870 |
| 2017 | $551 | $10,210 | $2,340 | $7,870 |
| 2016 | $541 | $10,000 | $2,390 | $7,610 |
| 2015 | $541 | $10,000 | $2,390 | $7,610 |
| 2014 | $493 | $9,150 | $2,390 | $6,760 |
Source: Public Records
Map
Nearby Homes
- 921 Candlestar Loop N
- 908 Candlestar Loop N
- 995 Square Dance Ln
- 947 Daffodil St
- 277 Turf Trail Place
- 978 Turf Trail Ct
- 886 Daffodil St
- 895 Rancher Dr Unit FOU
- 114 Turf Trail Place
- 1078 Clogger Ln
- 886 Square Dance Ln
- 9375 Bar B Rd
- 882 Square Dance Ln
- 7865 Wilson Rd
- 11376 Berry Farm Rd
- 11360 Berry Farm Rd
- 7524 Barn Owl Dr
- 11288 Berry Farm Rd
- 10617 Darneal Dr
- 7 Circle c Rd
- 952 Candlestar Loop N
- 944 Candlestar Loop N
- 959 Candlestar Loop S
- 955 Candlestar Loop S
- 956 Candlestar Loop N
- 940 Candlestar Loop N
- 951 Candlestar Loop S
- 945 Candlestar Loop N
- 949 Candlestar Loop N
- 967 Candlestar Loop S
- 947 Candlestar Loop S
- 936 Candlestar Loop N
- 941 Candlestar Loop N
- 953 Candlestar Loop N
- 960 Candlestar Loop N
- 971 Candlestar Loop S
- 957 Candlestar Loop N
- 937 Candlestar Loop N
- 970 Candlestar Loop S
- 974 Candlestar Loop S
Your Personal Tour Guide
Ask me questions while you tour the home.