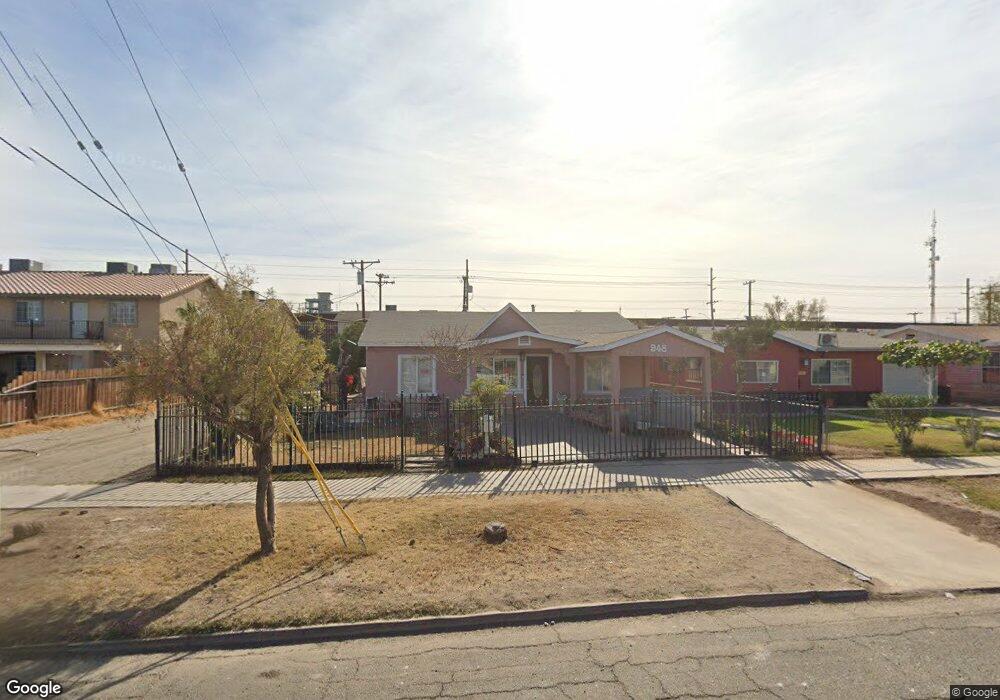
948 E 2nd St Calexico, CA 92231
Estimated Value: $346,000 - $368,000
3
Beds
2
Baths
1,540
Sq Ft
$231/Sq Ft
Est. Value
About This Home
This home is located at 948 E 2nd St, Calexico, CA 92231 and is currently estimated at $355,639, approximately $230 per square foot. 948 E 2nd St is a home located in Imperial County with nearby schools including Jefferson Elementary School, Enrique Camarena Junior High School, and Calexico High School.
Ownership History
Date
Name
Owned For
Owner Type
Purchase Details
Closed on
Nov 11, 2016
Sold by
Tabita Nathaniel Alexander
Bought by
Tabita Elizabeth
Current Estimated Value
Purchase Details
Closed on
Sep 13, 2013
Sold by
Tabita Elizabeth
Bought by
Tabita Nathaniel Alexander
Purchase Details
Closed on
Nov 25, 2005
Sold by
Espinoza Martin and Espinoza Angelina
Bought by
Rascon Jose Roman
Purchase Details
Closed on
Jul 9, 2004
Sold by
Moreno Ruben
Bought by
Tabita Elizabeth
Purchase Details
Closed on
Jun 24, 2000
Sold by
Elizabeth Tabita and Elizabeth Tabita
Bought by
Tabita Audelina
Create a Home Valuation Report for This Property
The Home Valuation Report is an in-depth analysis detailing your home's value as well as a comparison with similar homes in the area
Purchase History
| Date | Buyer | Sale Price | Title Company |
|---|---|---|---|
| Tabita Elizabeth | -- | None Available | |
| Tabita Nathaniel Alexander | -- | None Available | |
| Rascon Jose Roman | -- | None Available | |
| Tabita Elizabeth | -- | -- | |
| Tabita Elizabeth | -- | -- | |
| Tabita Audelina | -- | -- |
Source: Public Records
Tax History
| Year | Tax Paid | Tax Assessment Tax Assessment Total Assessment is a certain percentage of the fair market value that is determined by local assessors to be the total taxable value of land and additions on the property. | Land | Improvement |
|---|---|---|---|---|
| 2025 | $2,183 | $179,535 | $46,420 | $133,115 |
| 2023 | $2,183 | $172,565 | $44,618 | $127,947 |
| 2022 | $2,114 | $169,183 | $43,744 | $125,439 |
| 2021 | $2,052 | $165,867 | $42,887 | $122,980 |
| 2020 | $1,976 | $164,167 | $42,448 | $121,719 |
| 2019 | $1,919 | $160,949 | $41,616 | $119,333 |
| 2018 | $1,902 | $157,794 | $40,800 | $116,994 |
| 2017 | $1,764 | $154,700 | $40,000 | $114,700 |
| 2016 | $1,147 | $110,128 | $20,710 | $89,418 |
| 2015 | $1,126 | $108,474 | $20,399 | $88,075 |
| 2014 | $1,098 | $106,350 | $20,000 | $86,350 |
Source: Public Records
Map
Nearby Homes
- 941 E 1st St
- 1013 E 2nd St
- 737 Renaud Ct
- 810 E 6th St
- 817 E 6th St
- 618 E 5th St Unit B
- 618 E 5th St Unit A-B
- 510 E 3rd St
- 419 E 3rd St
- 415 E 3rd St
- 700 Blair Ave
- 816 Beach Ave
- 1237 D Hinojosa St
- 201 E Sherman St
- 631 Paulin Ave
- 21 E 7th St
- 21 E 7th St Unit 1
- 711 N Preston Dr
- 0 Avenida de Oro
- 1160 Rosas St Unit 152
Your Personal Tour Guide
Ask me questions while you tour the home.