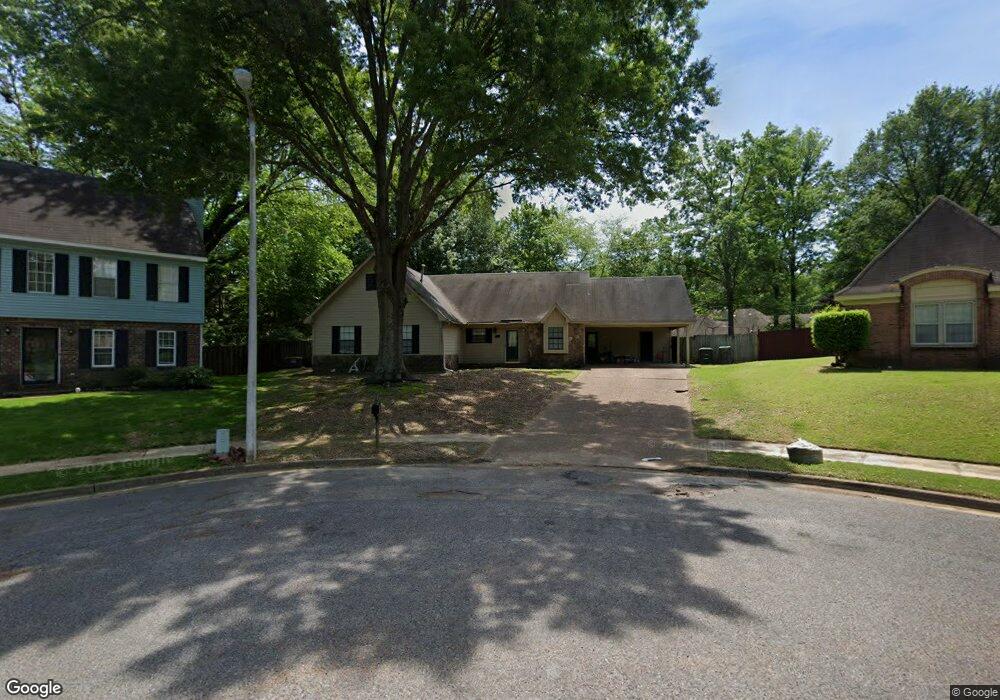
948 Grouse Meadows Dr Cordova, TN 38018
Cordova NeighborhoodEstimated Value: $223,000 - $252,785
3
Beds
2
Baths
2,426
Sq Ft
$99/Sq Ft
Est. Value
About This Home
This home is located at 948 Grouse Meadows Dr, Cordova, TN 38018 and is currently estimated at $241,196, approximately $99 per square foot. 948 Grouse Meadows Dr is a home located in Shelby County with nearby schools including Cordova Elementary School, Cordova Middle School, and Cordova High School.
Ownership History
Date
Name
Owned For
Owner Type
Purchase Details
Closed on
Aug 25, 2025
Sold by
Worley Calvin and Worley Amy
Bought by
Worley Gabrielle and Jackson Zachary T
Current Estimated Value
Home Financials for this Owner
Home Financials are based on the most recent Mortgage that was taken out on this home.
Original Mortgage
$166,920
Outstanding Balance
$166,920
Interest Rate
6.74%
Mortgage Type
Credit Line Revolving
Estimated Equity
$74,276
Purchase Details
Closed on
Aug 27, 2004
Sold by
Campbell Brian D and Campbell Meredith L
Bought by
Worley Calvin and Worley Amy
Home Financials for this Owner
Home Financials are based on the most recent Mortgage that was taken out on this home.
Original Mortgage
$128,750
Interest Rate
5.91%
Mortgage Type
Purchase Money Mortgage
Purchase Details
Closed on
Apr 16, 1996
Bought by
Defreece Thomas C and Defreece Kath
Create a Home Valuation Report for This Property
The Home Valuation Report is an in-depth analysis detailing your home's value as well as a comparison with similar homes in the area
Home Values in the Area
Average Home Value in this Area
Purchase History
| Date | Buyer | Sale Price | Title Company |
|---|---|---|---|
| Worley Gabrielle | $170,000 | None Listed On Document | |
| Worley Calvin | $129,500 | Realty Title | |
| Defreece Thomas C | $102,500 | -- |
Source: Public Records
Mortgage History
| Date | Status | Borrower | Loan Amount |
|---|---|---|---|
| Open | Worley Gabrielle | $166,920 | |
| Previous Owner | Defreece Thomas C | $112,433 | |
| Previous Owner | Worley Calvin | $128,750 |
Source: Public Records
Tax History Compared to Growth
Tax History
| Year | Tax Paid | Tax Assessment Tax Assessment Total Assessment is a certain percentage of the fair market value that is determined by local assessors to be the total taxable value of land and additions on the property. | Land | Improvement |
|---|---|---|---|---|
| 2025 | $1,619 | $62,975 | $13,750 | $49,225 |
| 2024 | $1,619 | $47,750 | $7,500 | $40,250 |
| 2023 | $2,909 | $47,750 | $7,500 | $40,250 |
| 2022 | $2,909 | $47,750 | $7,500 | $40,250 |
| 2021 | $2,943 | $47,750 | $7,500 | $40,250 |
| 2020 | $2,398 | $33,100 | $7,500 | $25,600 |
| 2019 | $2,398 | $33,100 | $7,500 | $25,600 |
| 2018 | $2,398 | $33,100 | $7,500 | $25,600 |
| 2017 | $1,360 | $33,100 | $7,500 | $25,600 |
| 2016 | $1,204 | $27,550 | $0 | $0 |
| 2014 | $1,204 | $27,550 | $0 | $0 |
Source: Public Records
Map
Nearby Homes
- 1012 Hunters Point Dr
- 7776 Grey Squirrel Cove
- 7893 Bentwood Cir
- 7952 Meadow Trail Dr
- 1102 Trappers Cove
- 7801 Autumn Creek Dr
- 984 Spinnaker Ln
- 883 Timber Trace Dr
- 1115 Hunters Green Cir S
- 8143 Timber Knoll Ln
- 7875 Brady Creek Cove
- 1130 Hunters Green Cir S
- 7659 Cordova Club Dr E
- 1289 Brady Hollow Ln
- 901 Timber Grove Dr
- 878 Timber Grove Dr
- 1220 Palmina Cove
- 7565 Wintergreen Ln
- 7486 Dal Whinnie Trail
- 7494 Links View Ln S
- 952 Grouse Meadows Dr
- 944 Grouse Meadows Dr
- 7874 Macon Rd
- 939 Pheasant Hollow Dr
- 947 Pheasant Hollow Dr
- 7864 Macon Rd
- 940 Grouse Meadow Dr
- 960 Grouse Meadows Dr
- 940 Grouse Meadows Dr
- 927 Pheasant Hollow Dr
- 955 Pheasant Hollow Dr
- 959 Grouse Meadows Dr
- 7856 Macon Rd
- 972 Grouse Meadows Dr
- 963 Pheasant Hollow Dr
- 942 Hunters Point Dr
- 969 Grouse Meadows Dr
- 7846 Macon Rd
- 960 Hunters Point Dr
- 948 Pheasant Hollow Dr