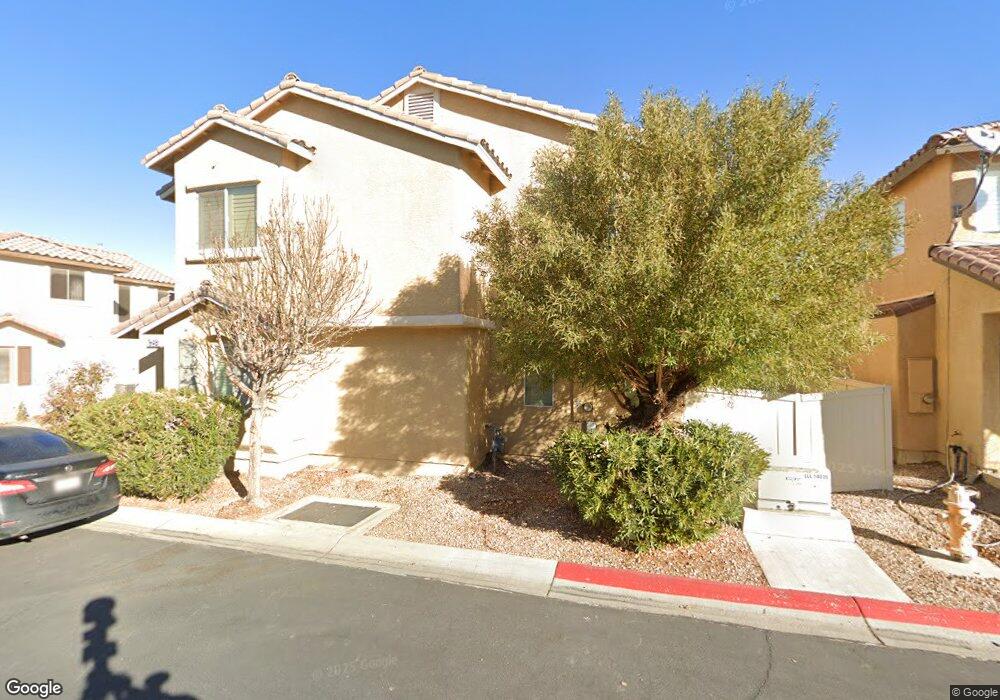
948 Monte de Oro Ave Unit 2 Las Vegas, NV 89183
Silverado Ranch NeighborhoodEstimated Value: $421,392 - $429,000
3
Beds
3
Baths
1,930
Sq Ft
$220/Sq Ft
Est. Value
About This Home
This home is located at 948 Monte de Oro Ave Unit 2, Las Vegas, NV 89183 and is currently estimated at $425,348, approximately $220 per square foot. 948 Monte de Oro Ave Unit 2 is a home located in Clark County with nearby schools including John C. Bass Elementary School, Charles Silvestri Junior High School, and Liberty High School.
Ownership History
Date
Name
Owned For
Owner Type
Purchase Details
Closed on
Feb 5, 2016
Sold by
Lee Ernest Kamsang and Lee Tan Lee Danise
Bought by
Lee Ernest Kamsang and Lee Tan Lee Danise
Current Estimated Value
Purchase Details
Closed on
Nov 3, 2011
Sold by
Asuncion Arnel and Asuncion Elsa
Bought by
Lee Ernest K and Lee Tan Lee D
Purchase Details
Closed on
Feb 3, 2005
Sold by
Oneill George H and Oneill Linda S
Bought by
Asuncion Arnel and Asuncion Elsa
Home Financials for this Owner
Home Financials are based on the most recent Mortgage that was taken out on this home.
Original Mortgage
$252,000
Interest Rate
5.74%
Mortgage Type
Unknown
Purchase Details
Closed on
Dec 5, 2002
Sold by
Richmond American Homes Of Nevada Inc
Bought by
The George H & Linda S Oneill Family Tr
Create a Home Valuation Report for This Property
The Home Valuation Report is an in-depth analysis detailing your home's value as well as a comparison with similar homes in the area
Home Values in the Area
Average Home Value in this Area
Purchase History
| Date | Buyer | Sale Price | Title Company |
|---|---|---|---|
| Lee Ernest Kamsang | -- | None Available | |
| Lee Ernest K | $119,000 | Old Republic Title Company | |
| Asuncion Arnel | $315,000 | North American Title Co | |
| The George H & Linda S Oneill Family Tr | $184,966 | First American Title Co |
Source: Public Records
Mortgage History
| Date | Status | Borrower | Loan Amount |
|---|---|---|---|
| Previous Owner | Asuncion Arnel | $252,000 | |
| Closed | Asuncion Arnel | $15,750 |
Source: Public Records
Tax History Compared to Growth
Tax History
| Year | Tax Paid | Tax Assessment Tax Assessment Total Assessment is a certain percentage of the fair market value that is determined by local assessors to be the total taxable value of land and additions on the property. | Land | Improvement |
|---|---|---|---|---|
| 2025 | $2,270 | $106,752 | $35,000 | $71,752 |
| 2024 | $2,102 | $106,752 | $35,000 | $71,752 |
| 2023 | $2,102 | $97,957 | $30,100 | $67,857 |
| 2022 | $1,947 | $85,714 | $23,800 | $61,914 |
| 2021 | $1,803 | $80,934 | $22,050 | $58,884 |
| 2020 | $1,671 | $80,414 | $22,050 | $58,364 |
| 2019 | $1,566 | $76,202 | $18,900 | $57,302 |
| 2018 | $1,494 | $69,112 | $14,350 | $54,762 |
| 2017 | $2,025 | $69,055 | $13,650 | $55,405 |
| 2016 | $1,399 | $64,383 | $10,500 | $53,883 |
| 2015 | $1,396 | $49,981 | $8,400 | $41,581 |
| 2014 | $1,352 | $46,941 | $5,250 | $41,691 |
Source: Public Records
Map
Nearby Homes
- 10568 Salmon Leap St
- 10656 Timber Stand St
- 10590 Medicine Bow St
- 967 Coronado Peak Ave
- 1043 Monte de Oro Ave
- 1041 Grand Cerritos Ave
- 10585 Pueblo Springs St
- 1050 E Cactus Ave Unit 2017
- 1050 E Cactus Ave Unit 1024
- 1050 E Cactus Ave Unit 2073
- 1050 E Cactus Ave Unit 1080
- 1050 E Cactus Ave Unit 2075
- 1069 Coronado Peak Ave
- 895 Beartooth Falls Ct
- 855 Beartooth Falls Ct
- 681 Stone Hammer Ave
- 1169 Nightmoss Ave
- 10366 Emerald Rye St
- 647 Great River Ave
- 911 Plantain Lily Ave
- 942 Monte de Oro Ave
- 954 Monte de Oro Ave
- 930 Monte de Oro Ave
- 960 Monte de Oro Ave
- 936 Monte de Oro Ave
- 945 Monte de Oro Ave
- 951 Monte de Oro Ave
- 10525 Silver Cholla Ct
- 10529 Silver Cholla Ct
- 927 Monte de Oro Ave
- 926 Monte de Oro Ave
- 926 Monte de Oro Ave Unit None
- 911 Valetta Flat Ave
- 922 Monte de Oro Ave
- 966 Monte de Oro Ave Unit 2
- 10532 Silver Cholla Ct Unit 3
- 969 Monte de Oro Ave
- 939 Monte de Oro Ave
- 957 Monte de Oro Ave
- 907 Valetta Flat Ave