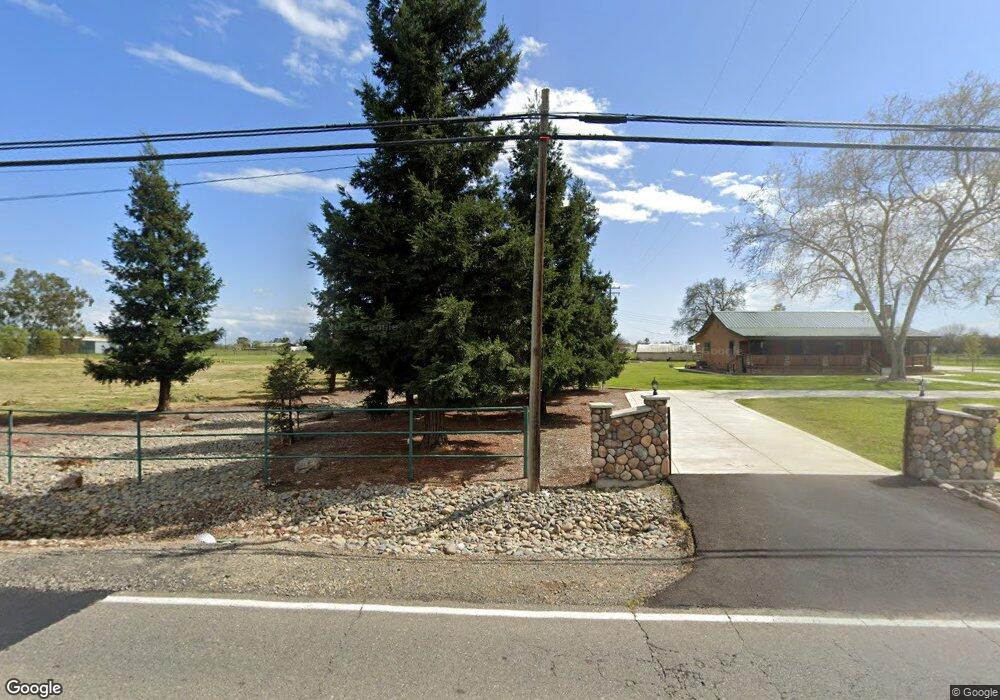
9481 Dillard Rd Wilton, CA 95693
Estimated Value: $783,000 - $1,000,000
3
Beds
2
Baths
1,816
Sq Ft
$470/Sq Ft
Est. Value
About This Home
This home is located at 9481 Dillard Rd, Wilton, CA 95693 and is currently estimated at $853,291, approximately $469 per square foot. 9481 Dillard Rd is a home located in Sacramento County with nearby schools including C.W. Dillard Elementary School, Katherine L. Albiani Middle School, and Pleasant Grove High School.
Ownership History
Date
Name
Owned For
Owner Type
Purchase Details
Closed on
May 8, 2023
Sold by
Craig David and Craig Kelly D
Bought by
David Martin Craig And Kelly Deaneen Craig Li
Current Estimated Value
Purchase Details
Closed on
Jul 15, 1994
Sold by
Nordquist Wendel and Nordquist Joan
Bought by
Craig David and Craig Kelly D
Home Financials for this Owner
Home Financials are based on the most recent Mortgage that was taken out on this home.
Original Mortgage
$159,200
Interest Rate
8.25%
Create a Home Valuation Report for This Property
The Home Valuation Report is an in-depth analysis detailing your home's value as well as a comparison with similar homes in the area
Home Values in the Area
Average Home Value in this Area
Purchase History
| Date | Buyer | Sale Price | Title Company |
|---|---|---|---|
| David Martin Craig And Kelly Deaneen Craig Li | -- | None Listed On Document | |
| Craig David | $199,000 | Fidelity National Title |
Source: Public Records
Mortgage History
| Date | Status | Borrower | Loan Amount |
|---|---|---|---|
| Previous Owner | Craig David | $159,200 |
Source: Public Records
Tax History
| Year | Tax Paid | Tax Assessment Tax Assessment Total Assessment is a certain percentage of the fair market value that is determined by local assessors to be the total taxable value of land and additions on the property. | Land | Improvement |
|---|---|---|---|---|
| 2025 | $5,037 | $476,410 | $201,553 | $274,857 |
| 2024 | $5,037 | $467,069 | $197,601 | $269,468 |
| 2023 | $4,787 | $457,912 | $193,727 | $264,185 |
| 2022 | $4,702 | $448,934 | $189,929 | $259,005 |
| 2021 | $4,657 | $440,132 | $186,205 | $253,927 |
| 2020 | $4,591 | $435,620 | $184,296 | $251,324 |
| 2019 | $4,504 | $427,080 | $180,683 | $246,397 |
| 2018 | $4,377 | $418,707 | $177,141 | $241,566 |
| 2017 | $4,297 | $410,498 | $173,668 | $236,830 |
| 2016 | $4,069 | $402,450 | $170,263 | $232,187 |
| 2015 | $3,988 | $396,406 | $167,706 | $228,700 |
| 2014 | $3,918 | $388,642 | $164,421 | $224,221 |
Source: Public Records
Map
Nearby Homes
- 7770 Dillard Rd
- 0 Colony Hill Ln
- 0 Alta Mesa Rd Unit 224117427
- 0 Parcel D Unit 226001796
- 11529 Arno Rd
- 9425 Montevideo Dr
- 11276 Randolph Rd
- 9777 Tavernor Rd
- 12049 Blake Rd
- 0 Davis Rd Unit 226005785
- 12501 Lee School Cross Rd
- 0 Blake Rd
- 12412 Plum Ln
- 12542 Plum Ln
- 12800 Rimfire Dr
- 8720 Tavernor Rd
- #1 Alta Mesa Rd
- 10676 Wilton Rd
- 10600 Colony Rd
- 10685 Halfway Rd
- 9471 Dillard Rd
- 9489 Dillard Rd
- 9484 Dillard Rd
- 11920 Miwok Ct
- 9483 Dillard Rd
- 9485 Dillard Rd
- 9500 Dillard Rd
- 9472 Dillard Rd
- 9454 Dillard Rd
- 11930 Miwok Ct
- 9400 Dillard Rd
- 9511 Dillard Rd
- 11940 Miwok Ct
- 9512 Dillard Rd
- 11830 Green Rd
- 9577 Alta Mesa Rd
- 11921 Miwok Ct
- 11780 Green Rd
- 9523 Alta Mesa Rd
- 9547 Alta Mesa Rd
Your Personal Tour Guide
Ask me questions while you tour the home.