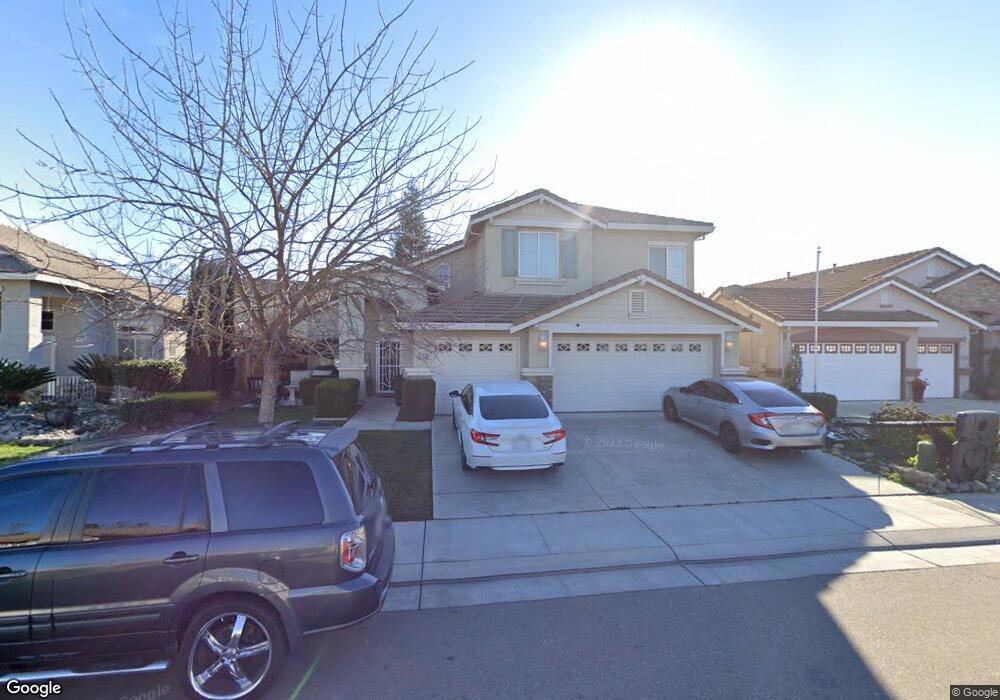
9489 Lembert Dome Cir Stockton, CA 95212
Valley Oak NeighborhoodEstimated Value: $225,000 - $564,000
5
Beds
3
Baths
2,063
Sq Ft
$222/Sq Ft
Est. Value
About This Home
This home is located at 9489 Lembert Dome Cir, Stockton, CA 95212 and is currently estimated at $458,897, approximately $222 per square foot. 9489 Lembert Dome Cir is a home located in San Joaquin County with nearby schools including Ansel Adams School, Morada Middle School, and Ronald E. McNair High School.
Ownership History
Date
Name
Owned For
Owner Type
Purchase Details
Closed on
May 12, 2010
Sold by
Rounsley Mark and Rounsley Pamela R B
Bought by
Carrasco Amanda M and Carrasco Gerardo
Current Estimated Value
Home Financials for this Owner
Home Financials are based on the most recent Mortgage that was taken out on this home.
Original Mortgage
$211,105
Outstanding Balance
$142,874
Interest Rate
5.25%
Mortgage Type
FHA
Estimated Equity
$316,023
Purchase Details
Closed on
Nov 20, 2003
Sold by
Rounsley Mark
Bought by
Rounsley Mark and Rounsley Pamela R B
Home Financials for this Owner
Home Financials are based on the most recent Mortgage that was taken out on this home.
Original Mortgage
$285,850
Interest Rate
6%
Mortgage Type
Purchase Money Mortgage
Purchase Details
Closed on
Oct 26, 2003
Sold by
Dunmore Homes Llc
Bought by
Rounsley Mark A
Home Financials for this Owner
Home Financials are based on the most recent Mortgage that was taken out on this home.
Original Mortgage
$285,850
Interest Rate
6%
Mortgage Type
Purchase Money Mortgage
Create a Home Valuation Report for This Property
The Home Valuation Report is an in-depth analysis detailing your home's value as well as a comparison with similar homes in the area
Home Values in the Area
Average Home Value in this Area
Purchase History
| Date | Buyer | Sale Price | Title Company |
|---|---|---|---|
| Carrasco Amanda M | $215,000 | Chicago Title Company | |
| Rounsley Mark | -- | -- | |
| Rounsley Mark Allen | -- | Alliance Title Co | |
| Rounsley Mark A | -- | Alliance Title Co |
Source: Public Records
Mortgage History
| Date | Status | Borrower | Loan Amount |
|---|---|---|---|
| Open | Carrasco Amanda M | $211,105 | |
| Previous Owner | Rounsley Mark Allen | $285,850 |
Source: Public Records
Tax History Compared to Growth
Tax History
| Year | Tax Paid | Tax Assessment Tax Assessment Total Assessment is a certain percentage of the fair market value that is determined by local assessors to be the total taxable value of land and additions on the property. | Land | Improvement |
|---|---|---|---|---|
| 2025 | $3,839 | $277,511 | $68,409 | $209,102 |
| 2024 | $3,770 | $272,070 | $67,068 | $205,002 |
| 2023 | $3,715 | $266,736 | $65,753 | $200,983 |
| 2022 | $3,630 | $261,507 | $64,464 | $197,043 |
| 2021 | $3,678 | $256,380 | $63,200 | $193,180 |
| 2020 | $3,655 | $253,752 | $62,552 | $191,200 |
| 2019 | $3,530 | $248,777 | $61,326 | $187,451 |
| 2018 | $3,469 | $243,900 | $60,124 | $183,776 |
| 2017 | $3,370 | $239,119 | $58,946 | $180,173 |
| 2016 | $3,315 | $234,432 | $57,790 | $176,642 |
| 2014 | $3,151 | $226,391 | $55,808 | $170,583 |
Source: Public Records
Map
Nearby Homes
- 9126 Verdicchio Ct
- 9516 San Marco Ct
- 9042 Chianti Cir
- 4520 E Morada Ln
- 9740 Palazzo Dr
- 9109 Valley Dr
- 3484 Cathedral Cir
- 9454 N Highway 99 Unit 9
- 9308 Pioneer Cir
- 9484 N Highway 99 Unit 44
- 8517 Kenny Ct
- 9253 Bridalveil Cir
- 3827 Vecchio Ln
- 4817 E Morada Ln
- 8061 Shay Cir
- 3709 Popolo Cir
- 8013 Shay Cir
- 3069 Nicoletta Ln
- 9704 Springfield Way
- 4320 Christian Life Way
- 9483 Lembert Dome Cir
- 9205 Lembert Dome Cir
- 3909 Mount Ritter Ct
- 9211 Lembert Dome Cir
- 3908 Lembert Dome Ct
- 3920 Lembert Dome Ct
- 3921 Mount Ritter Ct
- 9488 Lembert Dome Cir
- 3908 Mount Ritter Ct
- 9482 Lembert Dome Cir
- 9206 Lembert Dome Cir
- 9217 Lembert Dome Cir
- 3920 Mount Ritter Ct
- 3932 Lembert Dome Ct
- 3933 Mount Ritter Ct
- 9212 Lembert Dome Cir
- 9476 Lembert Dome Cir
- 9223 Lembert Dome Cir
- 3936 Mount Ritter Ct
- 9309 Lembert Dome Cir