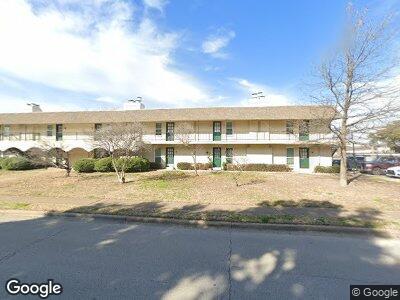
948G S Weatherred Dr Unit 948C Richardson, TX 75080
Richardson Heights NeighborhoodEstimated Value: $90,000 - $135,000
1
Bed
1
Bath
584
Sq Ft
$183/Sq Ft
Est. Value
About This Home
This home is located at 948G S Weatherred Dr Unit 948C, Richardson, TX 75080 and is currently estimated at $106,778, approximately $182 per square foot. 948G S Weatherred Dr Unit 948C is a home located in Dallas County with nearby schools including Math Science Technology Magnet Elementary School, Richardson West Jr. High School, and Richardson High School.
Ownership History
Date
Name
Owned For
Owner Type
Purchase Details
Closed on
Mar 6, 2025
Sold by
Lawson Marcus
Bought by
Knights Bridge Holdings Llc-948 Swd
Current Estimated Value
Purchase Details
Closed on
Sep 13, 2022
Sold by
Celli and Valerio
Bought by
Lawson Marcus
Home Financials for this Owner
Home Financials are based on the most recent Mortgage that was taken out on this home.
Original Mortgage
$68,000
Interest Rate
4.99%
Mortgage Type
New Conventional
Purchase Details
Closed on
Jun 19, 2017
Sold by
Perez Cardona Jesus Albertino and Pagan Jessica Luna
Bought by
Iungo Giacomo Valerio and Celli Daniela
Purchase Details
Closed on
Nov 14, 2016
Sold by
Thorne Thomsen Mark and Thorne Thomsen Gloria Y
Bought by
Cardona Jesus Albertino Perez and Pagan Jessica Luna
Create a Home Valuation Report for This Property
The Home Valuation Report is an in-depth analysis detailing your home's value as well as a comparison with similar homes in the area
Home Values in the Area
Average Home Value in this Area
Purchase History
| Date | Buyer | Sale Price | Title Company |
|---|---|---|---|
| Knights Bridge Holdings Llc-948 Swd | -- | None Listed On Document | |
| Lawson Marcus | -- | Capital Title | |
| Iungo Giacomo Valerio | -- | None Available | |
| Cardona Jesus Albertino Perez | -- | None Available |
Source: Public Records
Mortgage History
| Date | Status | Borrower | Loan Amount |
|---|---|---|---|
| Previous Owner | Lawson Marcus | $68,000 |
Source: Public Records
Tax History Compared to Growth
Tax History
| Year | Tax Paid | Tax Assessment Tax Assessment Total Assessment is a certain percentage of the fair market value that is determined by local assessors to be the total taxable value of land and additions on the property. | Land | Improvement |
|---|---|---|---|---|
| 2023 | $2,101 | $90,520 | $21,050 | $69,470 |
| 2022 | $2,213 | $90,520 | $21,050 | $69,470 |
| 2021 | $1,378 | $52,560 | $21,050 | $31,510 |
| 2020 | $1,403 | $52,560 | $21,050 | $31,510 |
| 2019 | $1,473 | $52,560 | $21,050 | $31,510 |
| 2018 | $1,326 | $49,640 | $7,020 | $42,620 |
| 2017 | $1,091 | $40,880 | $7,020 | $33,860 |
| 2016 | $421 | $15,770 | $7,020 | $8,750 |
| 2015 | $416 | $15,770 | $7,020 | $8,750 |
| 2014 | $416 | $15,770 | $7,020 | $8,750 |
Source: Public Records
Map
Nearby Homes
- 919 S Weatherred Dr Unit 211C
- 919 S Weatherred Dr Unit 140G
- 919 S Weatherred Dr Unit 113C
- 919 S Weatherred Dr Unit 108B
- 919 S Weatherred Dr Unit 127E
- 919 S Weatherred Dr Unit 153H
- 919 S Weatherred Dr Unit 212C
- 919 S Weatherred Dr Unit 152H
- 919 S Weatherred Dr Unit 219D
- 962 S Weatherred Dr Unit 962
- 717 Cliffside Dr
- 946 Blue Lake Cir
- 921 Blue Lake Cir
- 812 Bristol Ct
- 721 James Dr
- 503 S Weatherred Dr
- 719 Dumont Dr
- 1200 Ridgeway Dr
- 706 S Waterview Dr
- 1207 Dearborn Dr
- 948G S Weatherred Dr Unit 948D
- 948G S Weatherred Dr Unit 948C
- 948G S Weatherred Dr Unit 948B
- 948G S Weatherred Dr Unit 948A
- 950G S Weatherred Dr Unit 950
- 958G S Weatherred Dr Unit 958
- 952G S Weatherred Dr Unit 952
- 954G S Weatherred Dr Unit 954
- 954 S Weatherred Dr Unit 954
- 954 S Weatherred Dr
- 912 S Weatherred Dr Unit 912
- 952 S Weatherred Dr Unit 952
- 956G S Weatherred Dr Unit 956
- 914 S Weatherred Dr Unit 914
- 914 S Weatherred Dr
- 948 S Weatherred Dr Unit 948 C
- 948 S Weatherred Dr Unit 948A
- 948 S Weatherred Dr Unit C
- 948 S Weatherred Dr Unit 948D
- 916 S Weatherred Dr Unit 916