949 Dolores St Livermore, CA 94550
Estimated Value: $1,024,000 - $1,274,000
4
Beds
2
Baths
2,502
Sq Ft
$471/Sq Ft
Est. Value
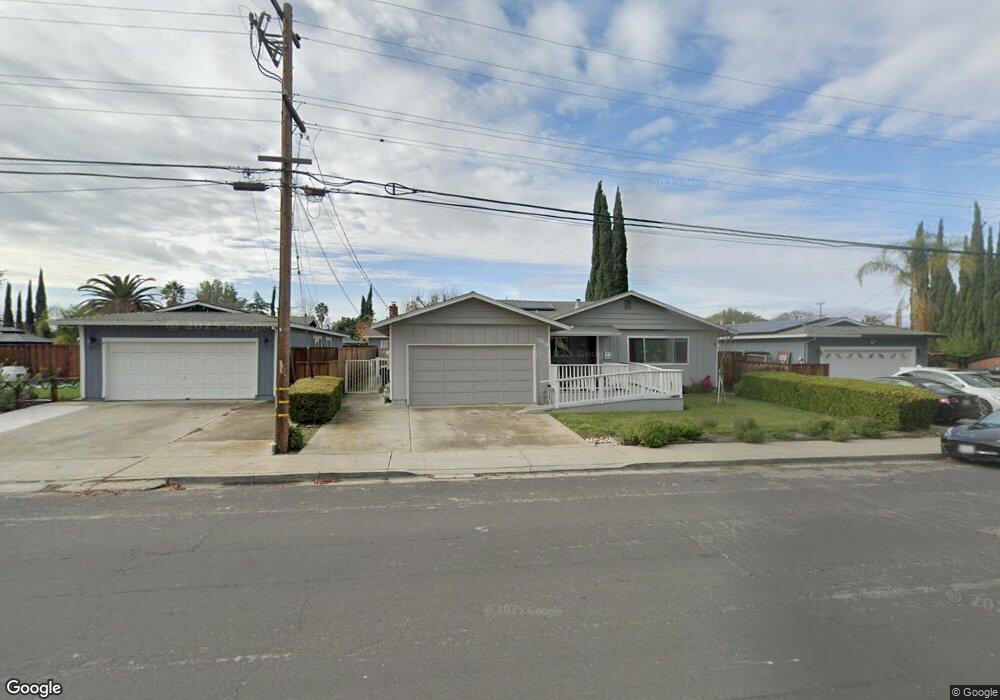
About This Home
This home is located at 949 Dolores St, Livermore, CA 94550 and is currently estimated at $1,177,901, approximately $470 per square foot. 949 Dolores St is a home located in Alameda County with nearby schools including Jackson Avenue Elementary School, East Avenue Middle School, and Livermore High School.
Ownership History
Date
Name
Owned For
Owner Type
Purchase Details
Closed on
Jul 27, 2016
Sold by
Soleta Arnold and Soleta Debbie
Bought by
Soleta Arnold and Soleta Debbie
Current Estimated Value
Purchase Details
Closed on
Jul 27, 2013
Sold by
Soleta Arnold B and Soleta Debbie P
Bought by
Soleta Arnold and Soleta Debbie
Purchase Details
Closed on
Jan 26, 2005
Sold by
Soleta Arnold B and Soleta Debbie
Bought by
Soleta Debbie
Home Financials for this Owner
Home Financials are based on the most recent Mortgage that was taken out on this home.
Original Mortgage
$427,500
Outstanding Balance
$216,147
Interest Rate
5.67%
Mortgage Type
New Conventional
Estimated Equity
$961,754
Purchase Details
Closed on
Apr 24, 2003
Sold by
Soleta Debbie P and Soleta Debbie A
Bought by
Soleta Arnold B and Soleta Debbie P
Purchase Details
Closed on
Sep 5, 1996
Sold by
Soleta Arnold
Bought by
Soleta Debbie A
Purchase Details
Closed on
Feb 11, 1994
Sold by
Pilapil Mariano T and Pilapil Melinda A
Bought by
Pilapil Melinda A and Soleta Debbie A
Create a Home Valuation Report for This Property
The Home Valuation Report is an in-depth analysis detailing your home's value as well as a comparison with similar homes in the area
Home Values in the Area
Average Home Value in this Area
Purchase History
| Date | Buyer | Sale Price | Title Company |
|---|---|---|---|
| Soleta Arnold | -- | None Available | |
| Soleta Arnold | -- | None Available | |
| Soleta Debbie | -- | Commonwealth Land Title Co | |
| Soleta Arnold B | -- | -- | |
| Soleta Debbie A | -- | Fidelity National Title Co | |
| Pilapil Melinda A | -- | -- |
Source: Public Records
Mortgage History
| Date | Status | Borrower | Loan Amount |
|---|---|---|---|
| Open | Soleta Debbie | $427,500 |
Source: Public Records
Tax History Compared to Growth
Tax History
| Year | Tax Paid | Tax Assessment Tax Assessment Total Assessment is a certain percentage of the fair market value that is determined by local assessors to be the total taxable value of land and additions on the property. | Land | Improvement |
|---|---|---|---|---|
| 2025 | $4,986 | $344,964 | $103,490 | $241,474 |
| 2024 | $4,986 | $338,200 | $101,461 | $236,739 |
| 2023 | $4,899 | $331,571 | $99,472 | $232,099 |
| 2022 | $4,816 | $325,070 | $97,522 | $227,548 |
| 2021 | $3,967 | $318,697 | $95,610 | $223,087 |
| 2020 | $4,562 | $315,430 | $94,630 | $220,800 |
| 2019 | $4,571 | $309,247 | $92,775 | $216,472 |
| 2018 | $4,462 | $303,185 | $90,956 | $212,229 |
| 2017 | $4,339 | $297,241 | $89,173 | $208,068 |
| 2016 | $4,164 | $291,414 | $87,425 | $203,989 |
| 2015 | $3,915 | $287,038 | $86,112 | $200,926 |
| 2014 | $3,845 | $281,416 | $84,425 | $196,991 |
Source: Public Records
Map
Nearby Homes
- 3732 Carrigan Common
- 3283 East Ave
- 1153 Sherry Way
- 3857 Pestana Way
- 3491 Madeira Way
- 1324 Chateau Common Unit 206
- 2878 4th St Unit 1401
- 2211 College Ave
- 3877 Santa Clara Way
- 2908 Worthing Common
- 3959 Purdue Way
- 3713 First St
- 236 Plum Tree St
- 3370 Gardella Plaza
- 2602 Lucca Ct
- 3973 Duke Way
- 1909 De Vaca Way
- 3971 Portola Common Unit 1
- 736 Adams Ave
- 1810 Peary Way