Estimated Value: $254,974 - $293,000
3
Beds
2
Baths
1,704
Sq Ft
$159/Sq Ft
Est. Value
About This Home
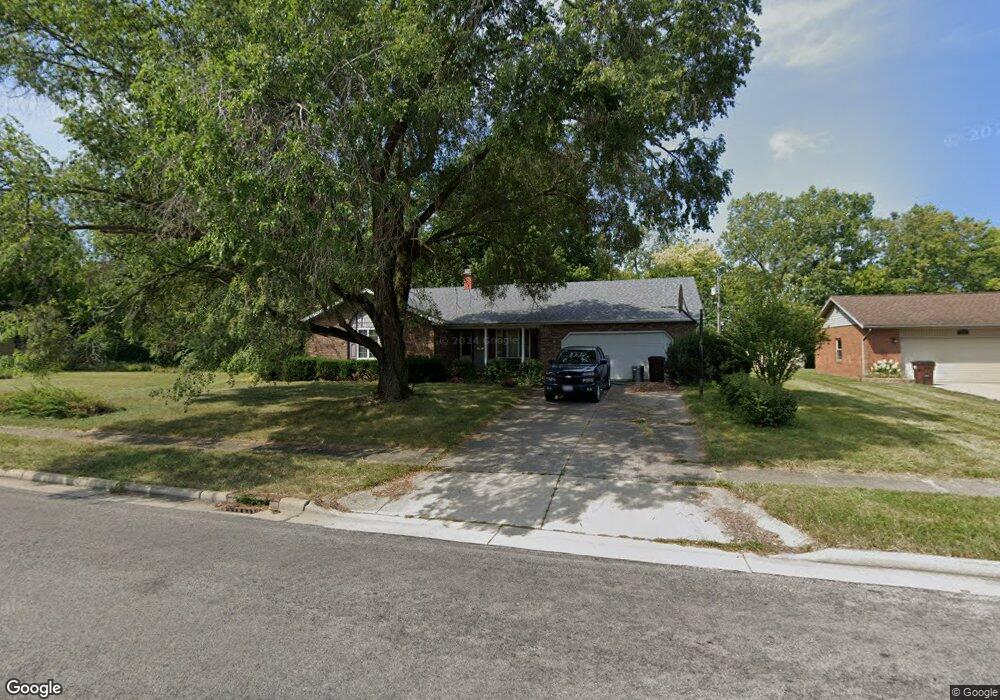
This home is located at 949 Fenway Dr, Lima, OH 45804 and is currently estimated at $271,494, approximately $159 per square foot. 949 Fenway Dr is a home located in Allen County with nearby schools including Bath Elementary School, Bath Middle School, and Bath High School.
Ownership History
Date
Name
Owned For
Owner Type
Purchase Details
Closed on
Jul 18, 2022
Bought by
Paul Stephen Driver
Current Estimated Value
Purchase Details
Closed on
May 6, 1998
Sold by
Arthur Larry
Bought by
Driver Paul and Driver Beverly
Home Financials for this Owner
Home Financials are based on the most recent Mortgage that was taken out on this home.
Original Mortgage
$57,000
Interest Rate
7.2%
Mortgage Type
New Conventional
Purchase Details
Closed on
Jul 17, 1986
Bought by
Driver Paul Stephen
Create a Home Valuation Report for This Property
The Home Valuation Report is an in-depth analysis detailing your home's value as well as a comparison with similar homes in the area
Purchase History
| Date | Buyer | Sale Price | Title Company |
|---|---|---|---|
| Paul Stephen Driver | -- | -- | |
| Driver Paul | $17,400 | -- | |
| Driver Paul Stephen | $75,000 | -- |
Source: Public Records
Mortgage History
| Date | Status | Borrower | Loan Amount |
|---|---|---|---|
| Previous Owner | Driver Paul | $57,000 |
Source: Public Records
Tax History
| Year | Tax Paid | Tax Assessment Tax Assessment Total Assessment is a certain percentage of the fair market value that is determined by local assessors to be the total taxable value of land and additions on the property. | Land | Improvement |
|---|---|---|---|---|
| 2024 | $2,750 | $72,840 | $11,760 | $61,080 |
| 2023 | $2,359 | $61,750 | $9,980 | $51,770 |
| 2022 | $2,404 | $61,750 | $9,980 | $51,770 |
| 2021 | $2,414 | $61,750 | $9,980 | $51,770 |
| 2020 | $2,013 | $49,110 | $9,450 | $39,660 |
| 2019 | $2,013 | $49,110 | $9,450 | $39,660 |
| 2018 | $1,978 | $49,110 | $9,450 | $39,660 |
| 2017 | $1,717 | $43,930 | $9,450 | $34,480 |
| 2016 | $1,704 | $43,930 | $9,450 | $34,480 |
| 2015 | $1,768 | $43,930 | $9,450 | $34,480 |
| 2014 | $1,768 | $44,000 | $9,450 | $34,550 |
| 2013 | $1,774 | $44,000 | $9,450 | $34,550 |
Source: Public Records
Map
Nearby Homes
- 819 Canyon Dr
- 115 Oakview Ct
- 633 Canyon Dr
- 800 Heritage Dr
- 120 Barnsbury Dr
- 108 Valley Way
- 125 Kensington Cir
- 1800 Reservoir Rd Unit Lot 51
- 712 Radcliffe St
- 2525 Harding Hwy
- 2223 Makin Dr
- 1656 Stewart Rd
- 1210 E Market St
- 124 N Perry St
- 1212 Bellefontaine Ave
- 00 Bellefontaine Ave
- 1503 Findlay Rd Unit Lot 6
- 3746 Armstead Place
- 650 S Dewey Ave
- 504 S Shawnee St
Your Personal Tour Guide
Ask me questions while you tour the home.