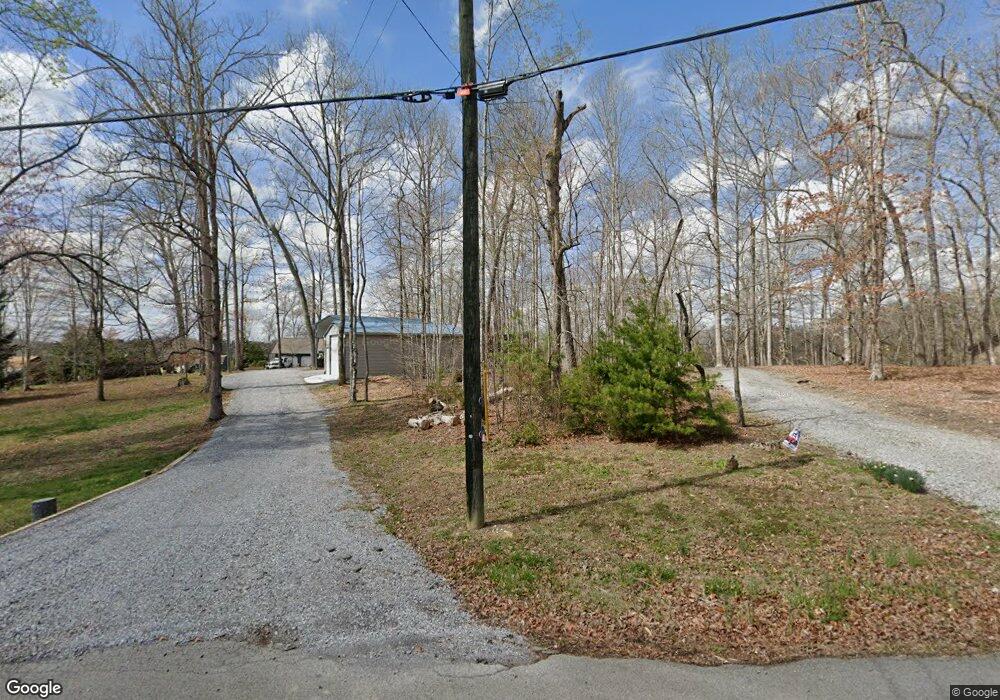
949 Holiday Ln Sevierville, TN 37876
Estimated Value: $341,000 - $378,268
--
Bed
2
Baths
1,256
Sq Ft
$286/Sq Ft
Est. Value
About This Home
This home is located at 949 Holiday Ln, Sevierville, TN 37876 and is currently estimated at $359,634, approximately $286 per square foot. 949 Holiday Ln is a home located in Sevier County with nearby schools including Catons Chapel Elementary School, Jones Cove Elementary School, and Northview Elementary School.
Ownership History
Date
Name
Owned For
Owner Type
Purchase Details
Closed on
Dec 29, 2020
Sold by
Chapman John and Chapman Jan
Bought by
Green Sharon and Green Hugh V
Current Estimated Value
Home Financials for this Owner
Home Financials are based on the most recent Mortgage that was taken out on this home.
Original Mortgage
$323,100
Outstanding Balance
$288,317
Interest Rate
2.7%
Mortgage Type
New Conventional
Estimated Equity
$71,317
Purchase Details
Closed on
Feb 4, 2020
Sold by
Chapman Jan and Chapman Walter
Bought by
Chapman John and Chapman Jan
Home Financials for this Owner
Home Financials are based on the most recent Mortgage that was taken out on this home.
Original Mortgage
$92,725
Interest Rate
3.74%
Mortgage Type
New Conventional
Purchase Details
Closed on
Oct 7, 2002
Bought by
Chapman John and Chapman Walter Chapman
Purchase Details
Closed on
Oct 7, 1991
Bought by
Zeh Darryle L and Zeh Virginia
Create a Home Valuation Report for This Property
The Home Valuation Report is an in-depth analysis detailing your home's value as well as a comparison with similar homes in the area
Home Values in the Area
Average Home Value in this Area
Purchase History
| Date | Buyer | Sale Price | Title Company |
|---|---|---|---|
| Green Sharon | $369,000 | Heritage Title Agency Inc | |
| Chapman John | -- | Vantage Point Title | |
| Chapman John | $235,500 | -- | |
| Zeh Darryle L | $22,900 | -- |
Source: Public Records
Mortgage History
| Date | Status | Borrower | Loan Amount |
|---|---|---|---|
| Open | Green Sharon | $323,100 | |
| Previous Owner | Chapman John | $92,725 |
Source: Public Records
Tax History Compared to Growth
Tax History
| Year | Tax Paid | Tax Assessment Tax Assessment Total Assessment is a certain percentage of the fair market value that is determined by local assessors to be the total taxable value of land and additions on the property. | Land | Improvement |
|---|---|---|---|---|
| 2025 | $905 | $61,175 | $18,750 | $42,425 |
| 2024 | $905 | $61,175 | $18,750 | $42,425 |
| 2023 | $905 | $61,175 | $0 | $0 |
| 2022 | $905 | $61,175 | $18,750 | $42,425 |
| 2021 | $905 | $61,175 | $18,750 | $42,425 |
| 2020 | $829 | $61,175 | $18,750 | $42,425 |
| 2019 | $829 | $44,575 | $16,875 | $27,700 |
| 2018 | $829 | $44,575 | $16,875 | $27,700 |
| 2017 | $829 | $44,575 | $16,875 | $27,700 |
| 2016 | $829 | $44,575 | $16,875 | $27,700 |
| 2015 | -- | $45,075 | $0 | $0 |
| 2014 | $735 | $45,070 | $0 | $0 |
Source: Public Records
Map
Nearby Homes
- 946 Holiday Ln
- 951 Hidden Harbor Ln
- 2521 Black Oak Ridge Rd
- 970 Hidden Harbor Ln
- 1006 Gordon Way
- 919 Buck Way
- 815 Penelope Ln
- 940 Buck Way
- 799 Penelope Ln
- 929 Buck Way
- 2594 Windfall Estates Dr
- 2607 Windfall Estates Dr
- Lot 31 Waterfront Way
- 2622 Camden Way
- 2626 Camden Way
- 2324 Mary Alice Way
- 1019 Moonside Ln
- Lot 71 Happy Hollow Ln
- 0 Happy Hollow Ln Unit 1273078
- 2099 Blue Iris Way
- 955 Holiday Ln
- 907 Holiday Ln
- 939 Holiday Ln
- 905 Holiday Ln
- 959 Holiday Ln
- 911 Holiday Ln
- 901 Holiday Ln
- 952 Holiday Ln
- 1003 Holiday Ln
- 910 Holiday Ln
- 2540 Leisure Way
- 926 Holiday Ln
- 2437 Black Oak Ridge Rd
- Lot 3 Leisure Way
- Lot 5 Leisure Way
- Lot 32 Holiday Ln
- 2529 Leisure Ct
- 2529 Leisure Ct
- 928 Holiday Ln
- 2515 Leisure Ct