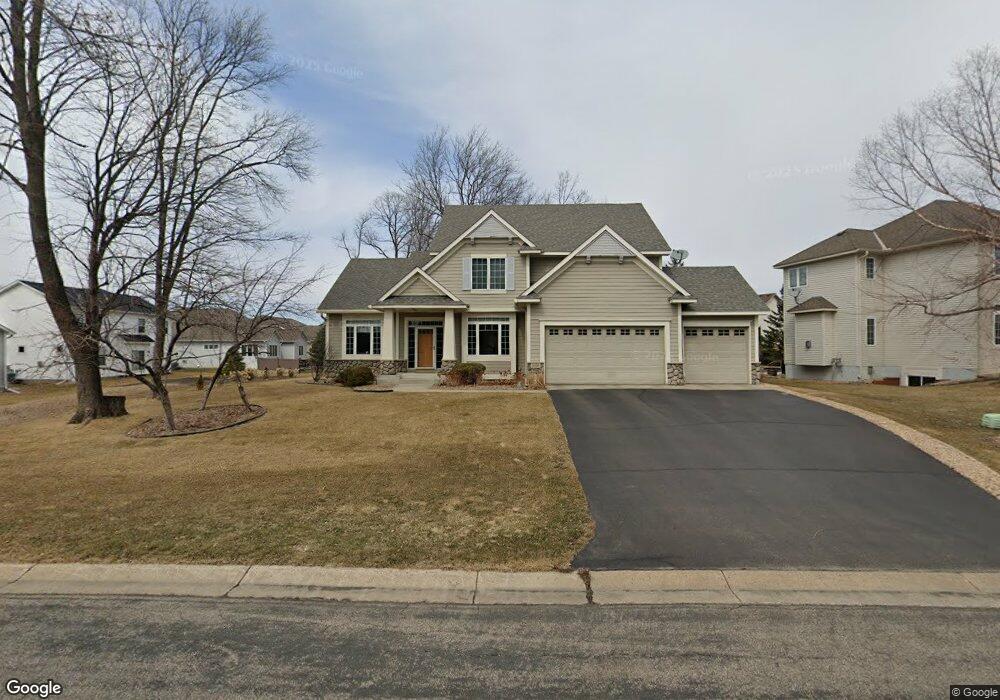
9490 138th St W Savage, MN 55378
Estimated Value: $578,723 - $662,000
5
Beds
4
Baths
2,644
Sq Ft
$237/Sq Ft
Est. Value
About This Home
This home is located at 9490 138th St W, Savage, MN 55378 and is currently estimated at $626,431, approximately $236 per square foot. 9490 138th St W is a home located in Scott County with nearby schools including Glendale Elementary School, Hidden Oaks Middle School, and Twin Oaks Middle School.
Ownership History
Date
Name
Owned For
Owner Type
Purchase Details
Closed on
Apr 30, 2015
Sold by
Messmer Carl J and Messmer Genevieve J
Bought by
Mong Brian and Mong Rachel
Current Estimated Value
Home Financials for this Owner
Home Financials are based on the most recent Mortgage that was taken out on this home.
Original Mortgage
$359,910
Outstanding Balance
$274,961
Interest Rate
3.77%
Mortgage Type
New Conventional
Estimated Equity
$351,470
Purchase Details
Closed on
Nov 10, 2014
Sold by
Messmer Carl Carl
Bought by
Mong Brian Brian
Home Financials for this Owner
Home Financials are based on the most recent Mortgage that was taken out on this home.
Original Mortgage
$359,910
Interest Rate
4.02%
Purchase Details
Closed on
Sep 1, 2006
Sold by
Sirva Relocation Llc
Bought by
Messmer Carl J and Messmer Genevieve J
Purchase Details
Closed on
Jul 6, 2001
Sold by
Creek Homes Llc
Bought by
Ailen Gam D and Ailen Susan C
Purchase Details
Closed on
Jan 12, 2001
Sold by
Arcon Development Inc
Bought by
Rock Creek Homes Llc
Create a Home Valuation Report for This Property
The Home Valuation Report is an in-depth analysis detailing your home's value as well as a comparison with similar homes in the area
Home Values in the Area
Average Home Value in this Area
Purchase History
| Date | Buyer | Sale Price | Title Company |
|---|---|---|---|
| Mong Brian | $399,900 | First American Title Company | |
| Mong Brian Brian | $399,900 | -- | |
| Messmer Carl J | $510,000 | -- | |
| Sirva Relocation Llc | $510,000 | -- | |
| Ailen Gam D | $396,742 | -- | |
| Rock Creek Homes Llc | $74,900 | -- |
Source: Public Records
Mortgage History
| Date | Status | Borrower | Loan Amount |
|---|---|---|---|
| Open | Mong Brian | $359,910 | |
| Previous Owner | Mong Brian Brian | $359,910 |
Source: Public Records
Tax History
| Year | Tax Paid | Tax Assessment Tax Assessment Total Assessment is a certain percentage of the fair market value that is determined by local assessors to be the total taxable value of land and additions on the property. | Land | Improvement |
|---|---|---|---|---|
| 2025 | $5,978 | $556,100 | $175,600 | $380,500 |
| 2024 | $5,866 | $546,400 | $183,100 | $363,300 |
| 2023 | $5,976 | $537,200 | $179,500 | $357,700 |
| 2022 | $5,948 | $556,900 | $163,200 | $393,700 |
| 2021 | $5,828 | $478,700 | $132,300 | $346,400 |
| 2020 | $6,038 | $450,300 | $102,000 | $348,300 |
| 2019 | $6,238 | $452,400 | $104,000 | $348,400 |
| 2018 | $6,902 | $0 | $0 | $0 |
| 2016 | $6,390 | $0 | $0 | $0 |
| 2014 | -- | $0 | $0 | $0 |
Source: Public Records
Map
Nearby Homes
- 9460 138th St W
- 9328 Woodridge Way
- 13936 Woodridge Path
- 13862 Kensington Ave NE
- 2269 Wildwood Dr
- 8927 W 136th St
- 13585 Crownline Dr NE
- 9125 Windsor Ave
- XXX County Road 42
- 14069 Greenway Ave NE
- 6412 Conroy St NE
- 13995 W Virginia Ave
- 14267 Shady Beach Dr NE
- 14307 Shady Beach Trail NE
- 6520 Harbor Place NE
- 9007 Meadow Place
- 14387 Watersedge Trail NE
- 14149 Ash Cir NE
- 13186 Meadow Ln
- 13136 Falcons Way
- 13647 Kensington Ave NE
- 13633 Kensington Ave NE
- 9394 138th Ct W
- 13619 Kensington Ave NE
- 9400 138th St W
- 9370 138th Ct W
- 9495 Woodridge Way
- 13667 Kensington Ave NE
- 13591 Kensington Ave NE
- 9451 138th St W
- 9451 W 138th St
- 13683 Kensington Ave NE
- 13640 Kensington Ave NE
- 13626 Kensington Ave NE
- 9483 Woodridge Way
- 9356 138th Ct W
- 9300 138th St W
- 13612 Kensington Ave NE
- 9445 138th St W
- 13697 Kensington Ave NE
Your Personal Tour Guide
Ask me questions while you tour the home.