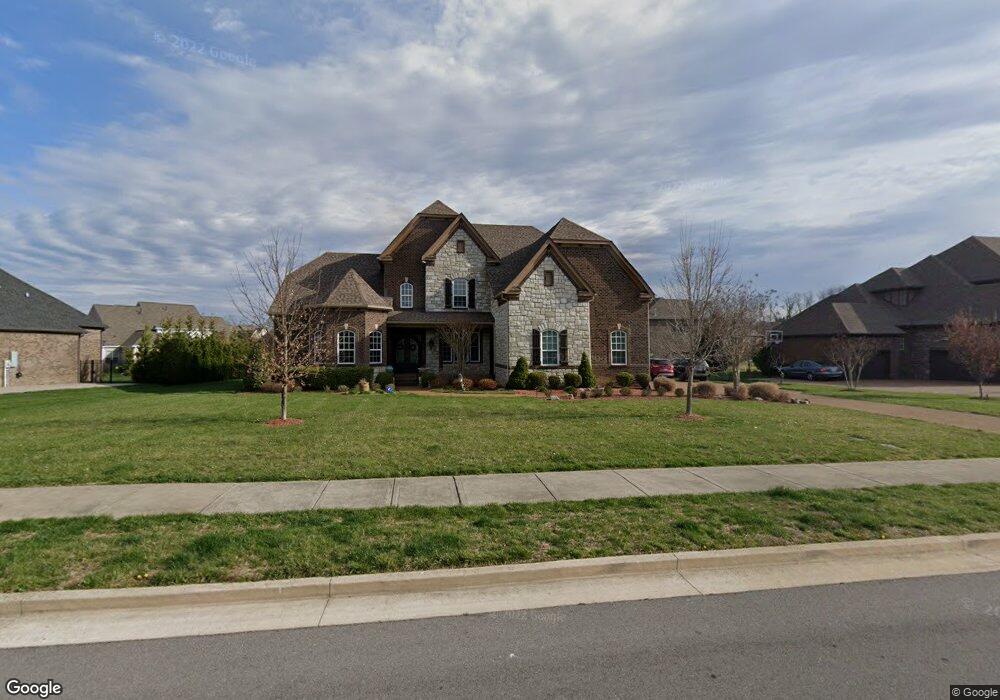
9490 Elgin Way Brentwood, TN 37027
Estimated Value: $1,750,631 - $1,946,000
4
Beds
4
Baths
5,050
Sq Ft
$366/Sq Ft
Est. Value
About This Home
This home is located at 9490 Elgin Way, Brentwood, TN 37027 and is currently estimated at $1,847,158, approximately $365 per square foot. 9490 Elgin Way is a home located in Williamson County with nearby schools including Jordan Elementary School, Sunset Middle School, and Ravenwood High School.
Ownership History
Date
Name
Owned For
Owner Type
Purchase Details
Closed on
Jan 14, 2021
Sold by
Aziz Anna
Bought by
Prasanna Arun and Vijayaraj Paul
Current Estimated Value
Home Financials for this Owner
Home Financials are based on the most recent Mortgage that was taken out on this home.
Original Mortgage
$856,000
Outstanding Balance
$761,685
Interest Rate
2.67%
Mortgage Type
New Conventional
Estimated Equity
$1,085,473
Purchase Details
Closed on
Aug 31, 2018
Sold by
Barnett Katrina Nicole and Barnett Ashley Michelle
Bought by
Aziz Anna
Home Financials for this Owner
Home Financials are based on the most recent Mortgage that was taken out on this home.
Original Mortgage
$494,500
Interest Rate
4.5%
Mortgage Type
New Conventional
Purchase Details
Closed on
Feb 20, 2015
Sold by
Drees Premier Homes Inc
Bought by
Barnett Michael
Purchase Details
Closed on
Mar 28, 2014
Sold by
Forestar Real Estate Group Inc
Bought by
Drees Premier Homes Inc
Create a Home Valuation Report for This Property
The Home Valuation Report is an in-depth analysis detailing your home's value as well as a comparison with similar homes in the area
Home Values in the Area
Average Home Value in this Area
Purchase History
| Date | Buyer | Sale Price | Title Company |
|---|---|---|---|
| Prasanna Arun | $1,070,000 | Advantage Title & Escrow | |
| Aziz Anna | $1,010,000 | Greenvue Title & Escrwo Llc | |
| Barnett Michael | $877,800 | Stewart Title Co Tennessee D | |
| Drees Premier Homes Inc | $270,000 | None Available |
Source: Public Records
Mortgage History
| Date | Status | Borrower | Loan Amount |
|---|---|---|---|
| Open | Prasanna Arun | $856,000 | |
| Previous Owner | Aziz Anna | $494,500 |
Source: Public Records
Tax History Compared to Growth
Tax History
| Year | Tax Paid | Tax Assessment Tax Assessment Total Assessment is a certain percentage of the fair market value that is determined by local assessors to be the total taxable value of land and additions on the property. | Land | Improvement |
|---|---|---|---|---|
| 2025 | $5,681 | $415,375 | $100,000 | $315,375 |
| 2024 | $5,681 | $261,825 | $42,500 | $219,325 |
| 2023 | $5,681 | $261,825 | $42,500 | $219,325 |
| 2022 | $5,681 | $261,825 | $42,500 | $219,325 |
| 2021 | $5,681 | $261,825 | $42,500 | $219,325 |
| 2020 | $5,678 | $220,100 | $35,000 | $185,100 |
| 2019 | $5,678 | $220,100 | $35,000 | $185,100 |
| 2018 | $5,524 | $220,100 | $35,000 | $185,100 |
| 2017 | $5,480 | $220,100 | $35,000 | $185,100 |
| 2016 | $0 | $220,100 | $35,000 | $185,100 |
| 2015 | -- | $203,000 | $31,250 | $171,750 |
| 2014 | -- | $31,250 | $31,250 | $0 |
Source: Public Records
Map
Nearby Homes
- 1851 Barnstaple Ln
- 9479 Helston Ct
- 1832 Ivy Crest Dr
- 1830 Kettering Trace
- 1801 Morgan Farms Way
- 1931 Parade Dr
- 9560 Dresden Square
- 1852 Traditions Cir
- 9539 Dresden Square
- 9535 Whitby Crest Ct
- 1884 Barnstaple Ln
- 9550 Faulkner Square
- 1885 Barnstaple Ln
- 9488 Stillbrook Trace
- 1742 Barrow Ln
- 1901 New Bristol Ln
- 1932 New Bristol Ln
- 1930 New Bristol Ln
- 1934 New Bristol Ln
- 1800 Grey Pointe Dr
- 9490 Elgin Way
- 9488 Elgin Way
- 9492 Elgin Way
- 9488 Elgin Way
- 1821 Tiverton Place
- 1821 Tiverton Place
- 9491 Elgin Way
- 1817 Tiverton Place
- 1826 Tiverton Way Lot 41
- 9491 Elgin Way
- 1830 Barnstaple Ln
- 1817 Tiverton Place
- 9489 Elgin Way
- 9489 Elgin Way
- 1832 Barnstaple Ln
- 1832 Barnstaple Ln
- 9493 Elgin Way
- 1828 Barnstaple Ln Unit 70
- 1828 Barnstaple Ln
- 9487 Elgin Way