9492 Sun Meadow Ct Rancho Cucamonga, CA 91730
Estimated Value: $888,000 - $1,034,654
3
Beds
4
Baths
3,771
Sq Ft
$251/Sq Ft
Est. Value
About This Home
This home is located at 9492 Sun Meadow Ct, Rancho Cucamonga, CA 91730 and is currently estimated at $948,164, approximately $251 per square foot. 9492 Sun Meadow Ct is a home located in San Bernardino County with nearby schools including Ontario Center School, Rancho Cucamonga Middle, and Colony High.
Ownership History
Date
Name
Owned For
Owner Type
Purchase Details
Closed on
Feb 13, 2020
Sold by
Arencibia Julio and Arencibia Odalys
Bought by
Arencibia Julio and Arencibia Odalys
Current Estimated Value
Home Financials for this Owner
Home Financials are based on the most recent Mortgage that was taken out on this home.
Original Mortgage
$338,000
Outstanding Balance
$299,275
Interest Rate
3.6%
Mortgage Type
New Conventional
Estimated Equity
$648,889
Purchase Details
Closed on
Aug 11, 2016
Sold by
Arencibia Julio
Bought by
Arencibia Julio and Arencibia Odalys
Purchase Details
Closed on
May 3, 2002
Sold by
Centex Homes
Bought by
Arencibia Julio A and Arencibia Odalys
Home Financials for this Owner
Home Financials are based on the most recent Mortgage that was taken out on this home.
Original Mortgage
$296,614
Interest Rate
10.5%
Create a Home Valuation Report for This Property
The Home Valuation Report is an in-depth analysis detailing your home's value as well as a comparison with similar homes in the area
Home Values in the Area
Average Home Value in this Area
Purchase History
| Date | Buyer | Sale Price | Title Company |
|---|---|---|---|
| Arencibia Julio | -- | Stewart Title Guaranty Co | |
| Arencibia Julio | -- | None Available | |
| Arencibia Julio A | $371,000 | Commerce Title |
Source: Public Records
Mortgage History
| Date | Status | Borrower | Loan Amount |
|---|---|---|---|
| Open | Arencibia Julio | $338,000 | |
| Previous Owner | Arencibia Julio A | $296,614 |
Source: Public Records
Tax History Compared to Growth
Tax History
| Year | Tax Paid | Tax Assessment Tax Assessment Total Assessment is a certain percentage of the fair market value that is determined by local assessors to be the total taxable value of land and additions on the property. | Land | Improvement |
|---|---|---|---|---|
| 2025 | $7,245 | $579,020 | $125,573 | $453,447 |
| 2024 | $7,245 | $567,667 | $123,111 | $444,556 |
| 2023 | $7,085 | $556,536 | $120,697 | $435,839 |
| 2022 | $6,957 | $545,623 | $118,330 | $427,293 |
| 2021 | $6,886 | $534,925 | $116,010 | $418,915 |
| 2020 | $6,762 | $529,440 | $114,820 | $414,620 |
| 2019 | $6,712 | $519,059 | $112,569 | $406,490 |
| 2018 | $6,553 | $508,882 | $110,362 | $398,520 |
| 2017 | $6,333 | $498,904 | $108,198 | $390,706 |
| 2016 | $6,245 | $489,121 | $106,076 | $383,045 |
| 2015 | $6,191 | $481,774 | $104,483 | $377,291 |
| 2014 | $6,016 | $472,336 | $102,436 | $369,900 |
Source: Public Records
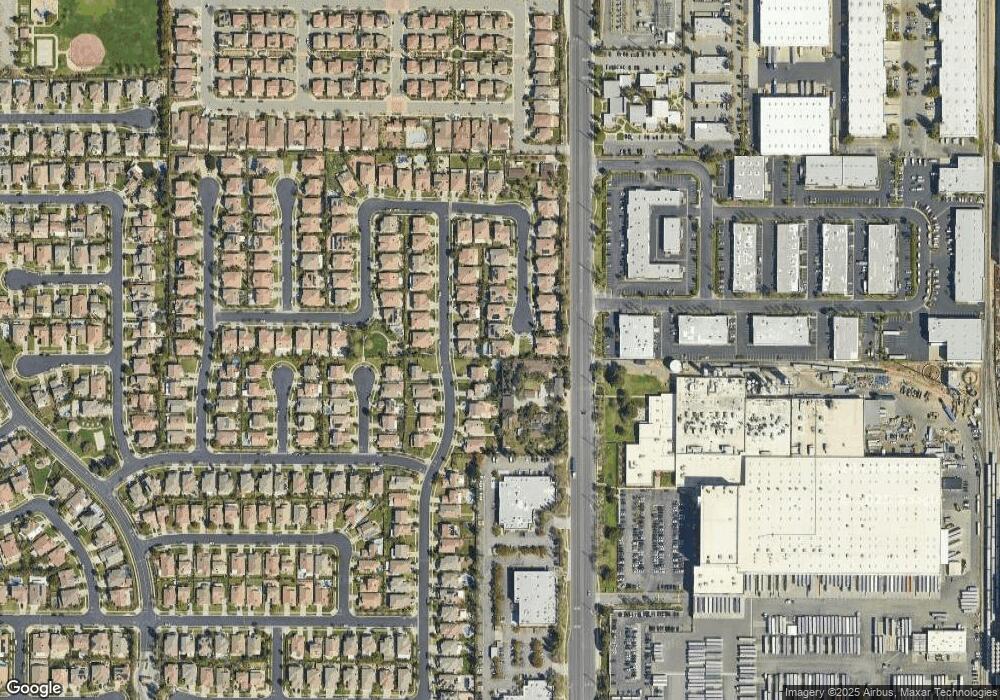
Map
Nearby Homes
- 9427 Sun Meadow Ct
- 9593 Brook Dr
- 9523 Sunglow Ct
- 9357 Culinary Place
- 9550 Springbrook Ct
- 9403 Old Post Dr
- 9175 Jadeite Ave
- 9330 Alderwood Dr
- 1044 N Turner Ave Unit 207
- 2139 E 4th St #244 St Unit 244
- 2927 E Via Terrano
- 2139 E 4th St Unit 79
- 2139 E 4th St Unit 230
- 2139 E 4th St Unit 176
- 2139 E 4th St Unit 13
- 2139 E 4th St Unit 135
- 2139 E 4th St Unit 244
- 2139 E 4th St Unit 39
- 2139 E 4th St Unit 142
- 948 N Turner Ave
- 9482 Sun Meadow Ct
- 9507 Cedar Glen Ct
- 9451 Cedar Glen Ct
- 9493 Cedar Glen Place
- 9508 Archibald Ave
- 9476 Sun Meadow Ct
- 9489 Cedar Glen Place
- 9489 Sun Meadow Ct
- 9517 Cedar Glen Ct
- 9475 Cedar Glen Place
- 9479 Sun Meadow Ct
- 9470 Sun Meadow Ct
- 9475 Sun Meadow Ct
- 9525 Cedar Glen Ct
- 9469 Cedar Glen Place
- 9458 Sun Meadow Ct
- 9461 Sun Meadow Ct
- 9533 Cedar Glen Ct
- 9457 Cedar Glen Place
- 9488 Cedar Glen Place