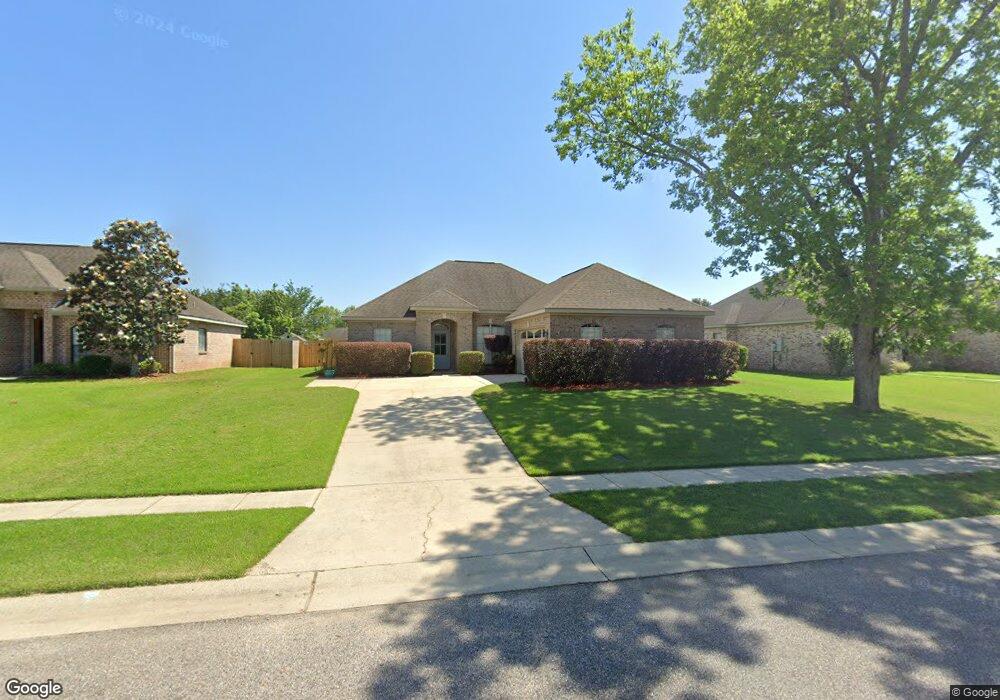
9497 Sanibel Loop Daphne, AL 36526
Estimated Value: $297,000 - $327,000
3
Beds
2
Baths
1,719
Sq Ft
$179/Sq Ft
Est. Value
About This Home
This home is located at 9497 Sanibel Loop, Daphne, AL 36526 and is currently estimated at $307,993, approximately $179 per square foot. 9497 Sanibel Loop is a home located in Baldwin County with nearby schools including Daphne East Elementary School, Daphne Middle School, and Daphne High School.
Ownership History
Date
Name
Owned For
Owner Type
Purchase Details
Closed on
May 12, 2023
Sold by
Shelley Belmonte And David Lund Family L
Bought by
Lund Belmonte Trust
Current Estimated Value
Purchase Details
Closed on
Mar 31, 2016
Sold by
Belmonte Shelley and Belmonte Michelle
Bought by
Lund David and Belmonte Shelley
Home Financials for this Owner
Home Financials are based on the most recent Mortgage that was taken out on this home.
Original Mortgage
$173,950
Interest Rate
3.68%
Mortgage Type
New Conventional
Purchase Details
Closed on
Jan 24, 2014
Sold by
Belmonte Michelle A
Bought by
Shelley Belmonte & David Lund Family Liv
Purchase Details
Closed on
Sep 19, 2007
Sold by
Homes By Hons Llc
Bought by
Belmonte Michelle A
Home Financials for this Owner
Home Financials are based on the most recent Mortgage that was taken out on this home.
Original Mortgage
$173,200
Interest Rate
6.49%
Mortgage Type
Purchase Money Mortgage
Create a Home Valuation Report for This Property
The Home Valuation Report is an in-depth analysis detailing your home's value as well as a comparison with similar homes in the area
Purchase History
| Date | Buyer | Sale Price | Title Company |
|---|---|---|---|
| Lund Belmonte Trust | $230,000 | None Listed On Document | |
| Lund David | $177,000 | Old Republic Title | |
| Belmonte Shelley | $176,950 | Old Republic Title | |
| Shelley Belmonte & David Lund Family Liv | $163,000 | None Available | |
| Belmonte Michelle A | -- | None Available |
Source: Public Records
Mortgage History
| Date | Status | Borrower | Loan Amount |
|---|---|---|---|
| Previous Owner | Belmonte Shelley | $173,950 | |
| Previous Owner | Belmonte Michelle A | $173,200 |
Source: Public Records
Tax History
| Year | Tax Paid | Tax Assessment Tax Assessment Total Assessment is a certain percentage of the fair market value that is determined by local assessors to be the total taxable value of land and additions on the property. | Land | Improvement |
|---|---|---|---|---|
| 2024 | $1,901 | $61,320 | $10,000 | $51,320 |
| 2023 | $1,655 | $53,400 | $9,600 | $43,800 |
| 2022 | $1,288 | $46,000 | $0 | $0 |
| 2021 | $1,198 | $41,980 | $0 | $0 |
| 2020 | $1,173 | $41,900 | $0 | $0 |
| 2019 | $1,161 | $41,460 | $0 | $0 |
| 2018 | $1,075 | $38,380 | $0 | $0 |
| 2017 | $1,045 | $36,920 | $0 | $0 |
| 2016 | $1,054 | $37,240 | $0 | $0 |
| 2015 | -- | $35,360 | $0 | $0 |
| 2014 | -- | $34,260 | $0 | $0 |
| 2013 | -- | $32,520 | $0 | $0 |
Source: Public Records
Map
Nearby Homes
- 9584 Sanibel Loop
- 9353 Bascayne Cir
- 9665 Pintail Ct
- 25998 Capra Ct
- 0 Montelucia Way Unit 7702068
- 0 Montelucia Way Unit 390036
- 9430 Volterra Ave
- 9508 Ottawa Dr
- 25732 Argonne Dr
- 24838 Slater Mill Rd
- 24979 Friendship Rd
- 0 County Road 64 Unit 358198
- 9763 Volterra Ave
- 9508 Volterra Ave
- 25280 Friendship Rd
- 9811 Volterra Ave
- 9817 Volterra Ave
- 26238 State Highway 181
- 9577 Volterra Ave
- 9158 Ashley Ct
- 9477 Sanibel Loop
- 9503 Sanibel Loop
- 9239 Coles Ct
- 9469 Sanibel Loop
- 9523 Sanibel Loop
- 9255 Coles Ct
- 9502 Sanibel Loop
- 9229 Coles Ct
- 9478 Sanibel Loop
- 9508 Sanibel Loop
- 9265 Coles Ct
- 9457 Sanibel Loop
- 9537 Sanibel Loop
- 9232 Coles Ct
- 9279 Coles Ct
- 9244 Cole Ct
- 9456 Sanibel Loop
- 9441 Sanibel Loop
- 9236 Cole Ct
- 9236 Coles Ct Unit 2
Your Personal Tour Guide
Ask me questions while you tour the home.