R
Seller's Agent in 2023
Rick Keller
Keller N Jadd
(702) 400-6000
4 Total Sales
Estimated Value: $325,205 - $344,000
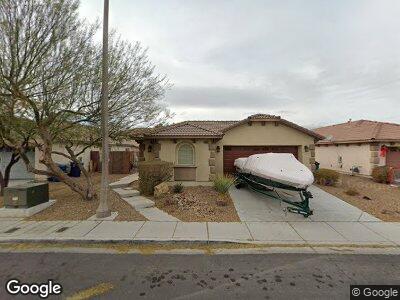
MOUNTAINS EDGE!!! BEAUTIFUL UPGRADE HOME IN A GREAT NEIGHBORHOOD! OPEN FLOOR PLAN! BEAUTIFUL TILE FLOORING THROUGHOUT!!! SPACIOUS, OPEN KITCHEN WITH CUSTOM CABINETS AND MARBLE COUNTERTOPS!!! ALL APPLIANCES INCLUDED!!! GOOD SIZED BEDROOMS AND BEAUTIFUL BATHROOMS WITH MARBLE FLOORING AND UPGRADE SINKS!
| Date | Buyer | Sale Price | Title Company |
|---|---|---|---|
| Rcl Investment Llc | -- | None Available | |
| Trt Investment Llc | $85,500 | None Available | |
| Dunham Jimmy W | $253,019 | Dhi Title |
| Date | Status | Borrower | Loan Amount |
|---|---|---|---|
| Previous Owner | Dunham Jimmy W | $202,416 |
| Date | Event | Price | Change | Sq Ft Price |
|---|---|---|---|---|
| 03/03/2023 03/03/23 | For Rent | $1,600 | 0.0% | -- |
| 03/03/2023 03/03/23 | Rented | $1,600 | -5.9% | -- |
| 08/06/2021 08/06/21 | For Rent | $1,700 | 0.0% | -- |
| 08/06/2021 08/06/21 | Rented | $1,700 | +30.8% | -- |
| 07/10/2019 07/10/19 | For Rent | $1,300 | 0.0% | -- |
| 07/10/2019 07/10/19 | Rented | $1,300 | +18.2% | -- |
| 11/03/2017 11/03/17 | For Rent | $1,100 | 0.0% | -- |
| 11/03/2017 11/03/17 | Rented | $1,100 | -2.2% | -- |
| 10/28/2016 10/28/16 | Rented | $1,125 | +13.1% | -- |
| 09/28/2016 09/28/16 | Under Contract | -- | -- | -- |
| 09/07/2016 09/07/16 | For Rent | $995 | -- | -- |
| Year | Tax Paid | Tax Assessment Tax Assessment Total Assessment is a certain percentage of the fair market value that is determined by local assessors to be the total taxable value of land and additions on the property. | Land | Improvement |
|---|---|---|---|---|
| 2025 | $1,477 | $86,939 | $31,500 | $55,439 |
| 2024 | $1,368 | $86,939 | $31,500 | $55,439 |
| 2023 | $1,368 | $78,289 | $28,000 | $50,289 |
| 2022 | $1,267 | $72,224 | $24,500 | $47,724 |
| 2021 | $1,174 | $61,380 | $21,700 | $39,680 |
| 2020 | $1,087 | $61,364 | $19,950 | $41,414 |
| 2019 | $1,019 | $60,279 | $19,250 | $41,029 |
| 2018 | $972 | $52,025 | $12,600 | $39,425 |
| 2017 | $1,503 | $51,231 | $11,900 | $39,331 |
| 2016 | $911 | $43,080 | $9,100 | $33,980 |
| 2015 | $908 | $30,510 | $7,000 | $23,510 |
| 2014 | $880 | $29,103 | $5,950 | $23,153 |
R
Seller's Agent in 2023
Rick Keller
Keller N Jadd
(702) 400-6000
4 Total Sales
M
Buyer's Agent in 2023
Michael Karagiozis
ERA Brokers Consolidated
(702) 883-3906
2 Total Sales
N
Buyer's Agent in 2021
Nancy Weber
Keller N Jadd
(702) 460-8484
1 Total Sale
J
Buyer's Agent in 2019
John Walker
Realty ONE Group, Inc
(702) 521-9314
1 in this area
55 Total Sales
A
Buyer's Agent in 2017
Adam Hare
Scofield Realty Inc.

Buyer's Agent in 2016
Steve Ord
Keller N Jadd
(702) 721-6928
1 in this area
130 Total Sales