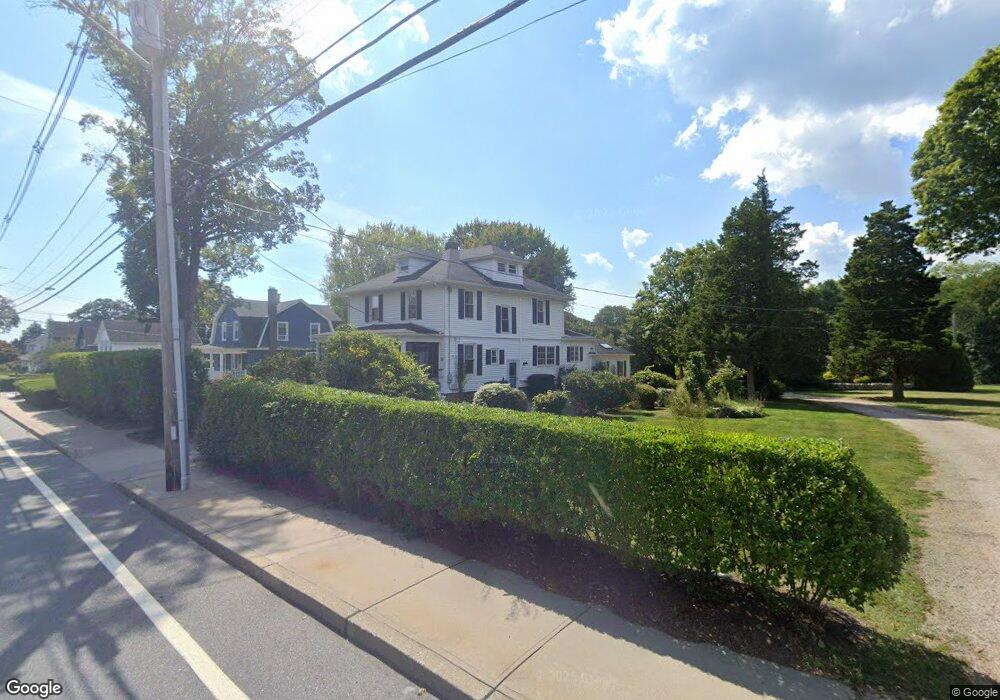
95 Beach St Westerly, RI 02891
Estimated Value: $566,000 - $746,000
4
Beds
2
Baths
2,350
Sq Ft
$283/Sq Ft
Est. Value
About This Home
This home is located at 95 Beach St, Westerly, RI 02891 and is currently estimated at $665,167, approximately $283 per square foot. 95 Beach St is a home located in Washington County with nearby schools including Westerly High School and St. Michael School.
Ownership History
Date
Name
Owned For
Owner Type
Purchase Details
Closed on
May 17, 2018
Sold by
Becker Daniel L
Bought by
Becker Jessica L
Current Estimated Value
Home Financials for this Owner
Home Financials are based on the most recent Mortgage that was taken out on this home.
Original Mortgage
$249,600
Outstanding Balance
$213,056
Interest Rate
4.4%
Mortgage Type
New Conventional
Estimated Equity
$452,111
Purchase Details
Closed on
Mar 19, 2013
Sold by
Corda Jessica L and Becker Daniel L
Bought by
Becker Jessica L and Becker Daniel L
Home Financials for this Owner
Home Financials are based on the most recent Mortgage that was taken out on this home.
Original Mortgage
$274,400
Interest Rate
3.54%
Mortgage Type
New Conventional
Purchase Details
Closed on
May 4, 2007
Sold by
Lyman Charles J and Lyman Barbara B
Bought by
Becker Daniel L and Corda Irwin
Home Financials for this Owner
Home Financials are based on the most recent Mortgage that was taken out on this home.
Original Mortgage
$192,500
Interest Rate
6.23%
Mortgage Type
Purchase Money Mortgage
Create a Home Valuation Report for This Property
The Home Valuation Report is an in-depth analysis detailing your home's value as well as a comparison with similar homes in the area
Home Values in the Area
Average Home Value in this Area
Purchase History
| Date | Buyer | Sale Price | Title Company |
|---|---|---|---|
| Becker Jessica L | $75,000 | -- | |
| Becker Daniel L | $332,500 | -- | |
| Becker Jessica L | -- | -- |
Source: Public Records
Mortgage History
| Date | Status | Borrower | Loan Amount |
|---|---|---|---|
| Open | Becker Jessica L | $249,600 | |
| Previous Owner | Becker Daniel L | $274,400 | |
| Previous Owner | Becker Daniel L | $188,000 | |
| Previous Owner | Becker Daniel L | $192,500 |
Source: Public Records
Tax History
| Year | Tax Paid | Tax Assessment Tax Assessment Total Assessment is a certain percentage of the fair market value that is determined by local assessors to be the total taxable value of land and additions on the property. | Land | Improvement |
|---|---|---|---|---|
| 2025 | $4,379 | $562,900 | $181,200 | $381,700 |
| 2024 | $4,429 | $423,800 | $129,500 | $294,300 |
| 2023 | $4,306 | $423,800 | $129,500 | $294,300 |
| 2022 | $4,280 | $423,800 | $129,500 | $294,300 |
| 2021 | $4,127 | $342,200 | $112,600 | $229,600 |
| 2020 | $4,055 | $342,200 | $112,600 | $229,600 |
| 2019 | $4,017 | $342,200 | $112,600 | $229,600 |
| 2018 | $3,770 | $305,300 | $112,600 | $192,700 |
| 2017 | $3,634 | $302,800 | $112,600 | $190,200 |
| 2016 | $3,634 | $302,800 | $112,600 | $190,200 |
| 2015 | $3,455 | $307,700 | $120,200 | $187,500 |
| 2014 | $3,400 | $307,700 | $120,200 | $187,500 |
Source: Public Records
Map
Nearby Homes
- 24 Abbey Ln Unit 13
- 9 Crestview Dr Unit C
- 23 Abbey Ln Unit 12
- 1 Jovere Dr
- 60 Margin St Unit 102
- 2 Pawcatuck Ave
- 33 Whipple Ave
- 14 Summertime Cir
- 18 Timothy Dr
- 65 Mechanic St
- 39 Summertime Cir
- 22 Summertime Cir
- 23 Summertime Cir
- 38 Summertime Cir
- 25 Summertime Cir
- 45 Summertime Cir
- 38 Prospect St
- 24 George St
- 25 School St Unit 2
- 77 Mechanic St
Your Personal Tour Guide
Ask me questions while you tour the home.