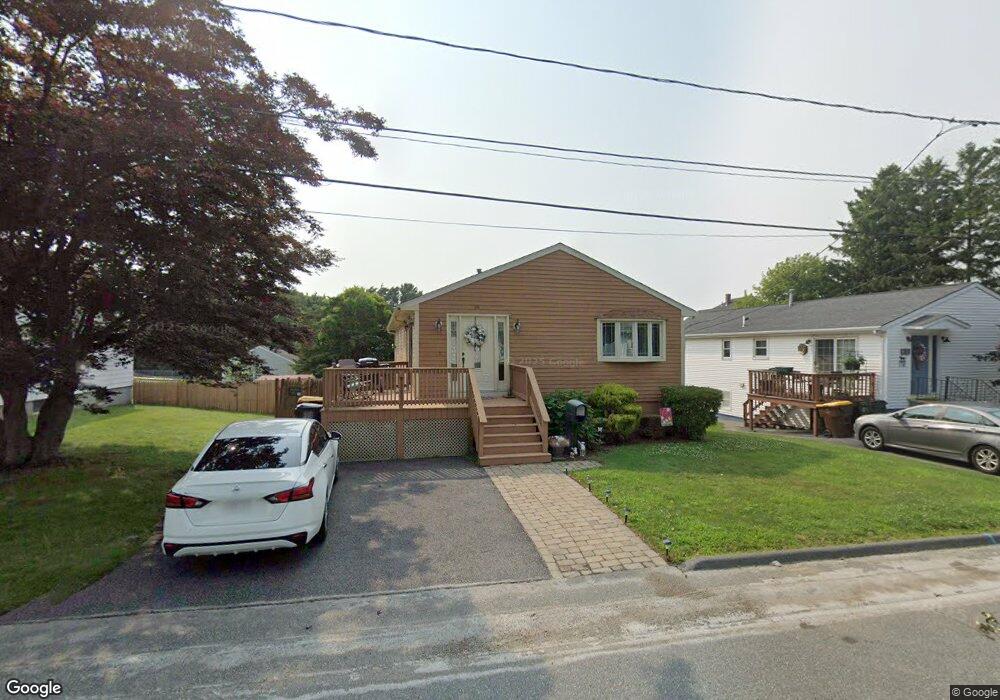
95 Butler St Fall River, MA 02724
Sandy Beach NeighborhoodEstimated Value: $411,000 - $434,000
3
Beds
2
Baths
1,674
Sq Ft
$253/Sq Ft
Est. Value
About This Home
This home is located at 95 Butler St, Fall River, MA 02724 and is currently estimated at $423,057, approximately $252 per square foot. 95 Butler St is a home located in Bristol County with nearby schools including Carlton M. Viveiros Elementary School, Matthew J. Kuss Middle School, and B M C Durfee High School.
Ownership History
Date
Name
Owned For
Owner Type
Purchase Details
Closed on
Jan 21, 2011
Sold by
Carreiro Dawn M and Pimentel Francisco A
Bought by
Carreiro Dawn M
Current Estimated Value
Purchase Details
Closed on
May 21, 2004
Sold by
Halbardier Colleen M and Halbardier David R
Bought by
Carreiro Dawn M and Pimentel Francisco A
Home Financials for this Owner
Home Financials are based on the most recent Mortgage that was taken out on this home.
Original Mortgage
$211,500
Interest Rate
5.75%
Mortgage Type
Purchase Money Mortgage
Purchase Details
Closed on
Jul 7, 1994
Sold by
A&J Rt and Resendes Jose
Bought by
Halbardier David R and Hallbardier Colleen M
Purchase Details
Closed on
Apr 13, 1994
Sold by
Montminy Alcide J and Montminy Evelyn P
Bought by
A&J Rt and Resendes Jose
Create a Home Valuation Report for This Property
The Home Valuation Report is an in-depth analysis detailing your home's value as well as a comparison with similar homes in the area
Home Values in the Area
Average Home Value in this Area
Purchase History
| Date | Buyer | Sale Price | Title Company |
|---|---|---|---|
| Carreiro Dawn M | -- | -- | |
| Carreiro Dawn M | $235,000 | -- | |
| Halbardier David R | $116,000 | -- | |
| A&J Rt | $32,000 | -- |
Source: Public Records
Mortgage History
| Date | Status | Borrower | Loan Amount |
|---|---|---|---|
| Closed | A&J Rt | $0 | |
| Previous Owner | A&J Rt | $211,500 | |
| Previous Owner | A&J Rt | $128,000 |
Source: Public Records
Tax History
| Year | Tax Paid | Tax Assessment Tax Assessment Total Assessment is a certain percentage of the fair market value that is determined by local assessors to be the total taxable value of land and additions on the property. | Land | Improvement |
|---|---|---|---|---|
| 2025 | $3,915 | $341,900 | $108,100 | $233,800 |
| 2024 | $3,645 | $317,200 | $104,100 | $213,100 |
| 2023 | $3,575 | $291,400 | $86,000 | $205,400 |
| 2022 | $3,123 | $247,500 | $81,900 | $165,600 |
| 2021 | $2,982 | $215,600 | $77,900 | $137,700 |
| 2020 | $2,887 | $199,800 | $76,800 | $123,000 |
| 2019 | $2,744 | $188,200 | $73,900 | $114,300 |
| 2018 | $2,820 | $192,900 | $80,100 | $112,800 |
| 2017 | $2,619 | $187,100 | $76,300 | $110,800 |
| 2016 | $2,538 | $186,200 | $81,200 | $105,000 |
| 2015 | $2,424 | $185,300 | $81,200 | $104,100 |
| 2014 | $2,301 | $182,900 | $78,800 | $104,100 |
Source: Public Records
Map
Nearby Homes
- 20 Wilcox St
- 464 Birch St
- 245 Dwelly St
- 609 King Philip St
- 1846 S Main St
- 1852 S Main St
- 1334 S Main St
- 1273-1279 S Main St
- 234 Kilburn St
- 917 Dwelly St
- 57 Larouche St
- 15 Higgins St
- 70 Brown St
- 344-354 E Main St
- 219 Montaup St
- 71 Mystic St Unit 3
- 240 Montaup St
- 616 Woodman St
- 82 Montaup St
- 126 Wheeler St
Your Personal Tour Guide
Ask me questions while you tour the home.