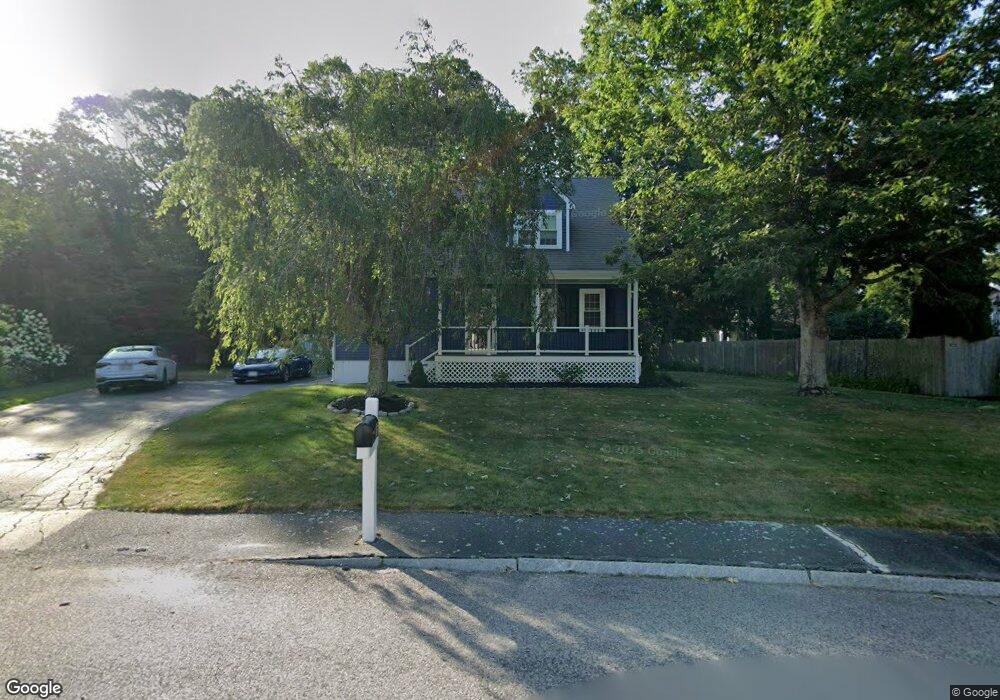
95 Calypso Ln Marshfield, MA 02050
Green Harbor-Cedar Crest NeighborhoodEstimated Value: $722,101 - $846,000
3
Beds
2
Baths
1,606
Sq Ft
$489/Sq Ft
Est. Value
About This Home
This home is located at 95 Calypso Ln, Marshfield, MA 02050 and is currently estimated at $785,025, approximately $488 per square foot. 95 Calypso Ln is a home located in Plymouth County with nearby schools including Governor Edward Winslow School, Furnace Brook Middle School, and Marshfield High School.
Ownership History
Date
Name
Owned For
Owner Type
Purchase Details
Closed on
Jul 19, 2006
Sold by
Mckenna Robert L and Mckenna Kelley J
Bought by
Rk Mckenna Ft
Current Estimated Value
Purchase Details
Closed on
Jul 29, 1994
Sold by
Conroy James P and Conroy Maribeth
Bought by
Mckenna Robert L and Higgins Kelley J
Purchase Details
Closed on
Apr 28, 1992
Sold by
Gray Taylor T and Gray Kathleen M
Bought by
Conroy James P and Conroy Maribeth
Purchase Details
Closed on
Sep 26, 1988
Sold by
Windjammer Rt
Bought by
Gray Taylor T
Create a Home Valuation Report for This Property
The Home Valuation Report is an in-depth analysis detailing your home's value as well as a comparison with similar homes in the area
Home Values in the Area
Average Home Value in this Area
Purchase History
| Date | Buyer | Sale Price | Title Company |
|---|---|---|---|
| Rk Mckenna Ft | -- | -- | |
| Rk Mckenna Ft | -- | -- | |
| Mckenna Robert L | $170,000 | -- | |
| Conroy James P | $164,500 | -- | |
| Gray Taylor T | $187,000 | -- |
Source: Public Records
Mortgage History
| Date | Status | Borrower | Loan Amount |
|---|---|---|---|
| Previous Owner | Gray Taylor T | $282,000 | |
| Previous Owner | Gray Taylor T | $240,000 | |
| Previous Owner | Gray Taylor T | $207,000 |
Source: Public Records
Tax History Compared to Growth
Tax History
| Year | Tax Paid | Tax Assessment Tax Assessment Total Assessment is a certain percentage of the fair market value that is determined by local assessors to be the total taxable value of land and additions on the property. | Land | Improvement |
|---|---|---|---|---|
| 2025 | $6,115 | $617,700 | $296,200 | $321,500 |
| 2024 | $5,978 | $575,400 | $282,100 | $293,300 |
| 2023 | $5,544 | $506,900 | $251,900 | $255,000 |
| 2022 | $5,544 | $428,100 | $211,600 | $216,500 |
| 2021 | $5,335 | $404,500 | $211,600 | $192,900 |
| 2020 | $5,123 | $384,300 | $191,400 | $192,900 |
| 2019 | $4,972 | $371,600 | $191,400 | $180,200 |
| 2018 | $4,847 | $362,500 | $191,400 | $171,100 |
| 2017 | $4,761 | $347,000 | $191,400 | $155,600 |
| 2016 | $4,714 | $339,600 | $191,400 | $148,200 |
| 2015 | $4,513 | $339,600 | $191,400 | $148,200 |
| 2014 | $4,431 | $333,400 | $191,400 | $142,000 |
Source: Public Records
Map
Nearby Homes
- 106 Careswell St
- 57 Island St
- 78 Tower Ave
- 71 Gurnet Rd
- 256 Ocean St
- 335 Ocean St
- 328 Ocean St
- 5 Adelaide Way
- 90 Presidential Cir
- 24 Second (2nd) Rd
- 19 2nd Rd
- 32 Gratto Rd
- 11 Leon St
- 30 Chandler Dr
- 74 Abrams Hill Rd
- 68 Abrams Hill Rd
- 713 Webster St
- 39 Bay Pond Rd
- 387 Lot 2A Old Cove Rd
- 387 Lot 3A Old Cove Rd