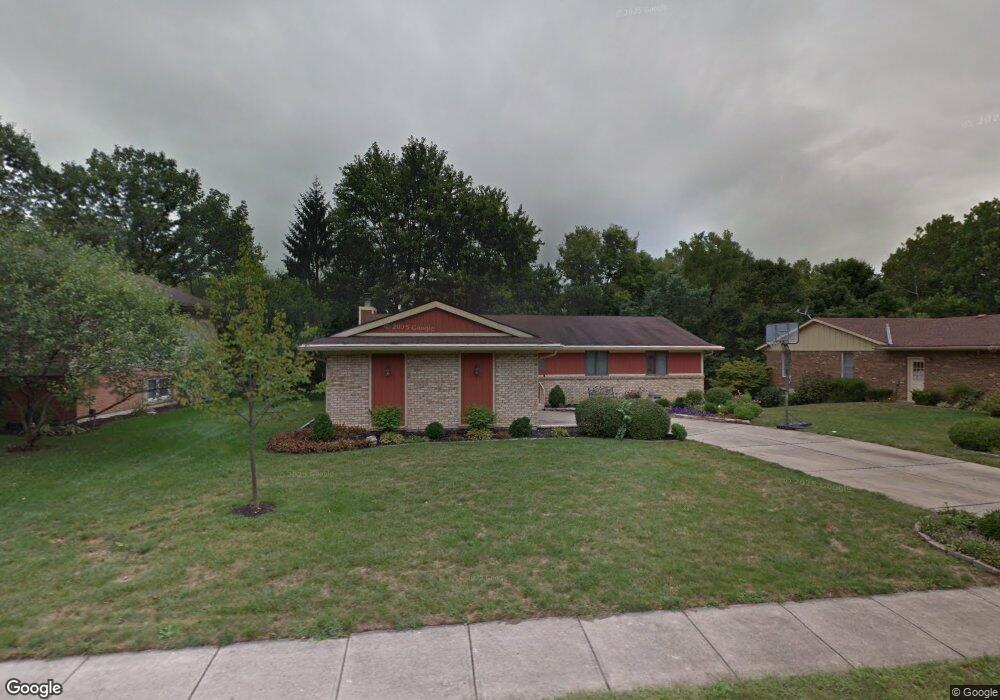
95 Clearview Dr Springboro, OH 45066
Estimated Value: $327,000 - $391,000
4
Beds
3
Baths
1,608
Sq Ft
$221/Sq Ft
Est. Value
About This Home
This home is located at 95 Clearview Dr, Springboro, OH 45066 and is currently estimated at $356,086, approximately $221 per square foot. 95 Clearview Dr is a home located in Warren County with nearby schools including Clearcreek Elementary School, Springboro Intermediate School, and Dennis Elementary School.
Ownership History
Date
Name
Owned For
Owner Type
Purchase Details
Closed on
Jul 29, 1994
Sold by
Engelman Steven E
Bought by
Carroll Michael L and Carroll R
Current Estimated Value
Home Financials for this Owner
Home Financials are based on the most recent Mortgage that was taken out on this home.
Original Mortgage
$135,900
Interest Rate
8.41%
Mortgage Type
New Conventional
Purchase Details
Closed on
May 15, 1992
Sold by
Engelman Engelman and Engelman Steven S
Bought by
Engelman Engelman and Engelman Steven S
Purchase Details
Closed on
Feb 7, 1990
Sold by
Labbe Labbe and Labbe Ronald H
Bought by
Engelman Engelman and Engelman Steven S
Purchase Details
Closed on
Jun 6, 1988
Sold by
Leever Leever and Leever Richard L
Bought by
Labbe Labbe and Labbe Ronald H
Purchase Details
Closed on
Dec 18, 1984
Sold by
Kar-Len Designs & Inc
Bought by
Leever and Leever Richard L
Purchase Details
Closed on
Jan 4, 1984
Sold by
Tri-Ohio Dev Co
Bought by
Kar-Len Designs & Inc
Purchase Details
Closed on
Jul 19, 1978
Sold by
Tri-Ohio Development Co
Create a Home Valuation Report for This Property
The Home Valuation Report is an in-depth analysis detailing your home's value as well as a comparison with similar homes in the area
Home Values in the Area
Average Home Value in this Area
Purchase History
| Date | Buyer | Sale Price | Title Company |
|---|---|---|---|
| Carroll Michael L | $151,000 | -- | |
| Engelman Engelman | -- | -- | |
| Engelman Engelman | $136,900 | -- | |
| Labbe Labbe | $128,500 | -- | |
| Leever | $109,900 | -- | |
| Kar-Len Designs & Inc | $16,200 | -- | |
| -- | -- | -- |
Source: Public Records
Mortgage History
| Date | Status | Borrower | Loan Amount |
|---|---|---|---|
| Closed | Carroll Michael L | $135,900 |
Source: Public Records
Tax History
| Year | Tax Paid | Tax Assessment Tax Assessment Total Assessment is a certain percentage of the fair market value that is determined by local assessors to be the total taxable value of land and additions on the property. | Land | Improvement |
|---|---|---|---|---|
| 2025 | $3,996 | $102,330 | $24,500 | $77,830 |
| 2024 | $3,996 | $102,330 | $24,500 | $77,830 |
| 2023 | $3,520 | $82,652 | $16,520 | $66,132 |
| 2022 | $3,468 | $82,653 | $16,520 | $66,133 |
| 2021 | $3,227 | $82,653 | $16,520 | $66,133 |
| 2020 | $3,129 | $70,046 | $14,000 | $56,046 |
| 2019 | $2,885 | $70,046 | $14,000 | $56,046 |
| 2018 | $2,887 | $70,046 | $14,000 | $56,046 |
| 2017 | $2,725 | $59,563 | $12,096 | $47,467 |
| 2016 | $2,842 | $59,563 | $12,096 | $47,467 |
| 2015 | $2,810 | $59,563 | $12,096 | $47,467 |
| 2014 | $2,810 | $55,670 | $11,310 | $44,360 |
| 2013 | $2,808 | $68,940 | $14,000 | $54,940 |
Source: Public Records
Map
Nearby Homes
- 225 Renwood Place
- 245 Whispering Pines St
- 23 Pheasant Run Cir Unit 9A
- 35 Edgebrooke Dr
- 340 Saint James Place
- 10 Woods Rd
- 350 Spruceway Dr
- 4 Chestnut St
- 72 Pebble Brook Place
- 80 Elkins Ln
- 70 Eleanor Dr
- 20 Terradyne Trace
- 45 Wadestone St
- 40 Libby Hollow St
- 90 Libby Hollow St
- 140 Dan Haven Place
- 15 Wadestone Ln
- 105 Cherry St
- 65 Ed Knoll Bend
- 510 Royal Springs Dr
- 105 Clearview Dr
- 30 Jacamar Ct
- 40 Jacamar Ct
- 75 Clearview Dr
- 90 Clearview Dr
- 115 Clearview Dr
- 100 Clearview Dr
- 20 Jacamar Ct
- 70 Clearview Dr
- 110 Clearview Dr
- 125 Clearview Dr
- 155 Springwood Dr
- 35 Jacamar Ct
- 10 Jacamar Ct
- 60 Clearview Dr
- 275 Park Ln
- 25 Jacamar Ct
- 265 Park Ln
- 135 Clearview Dr
- 130 Clearview Dr
Your Personal Tour Guide
Ask me questions while you tour the home.