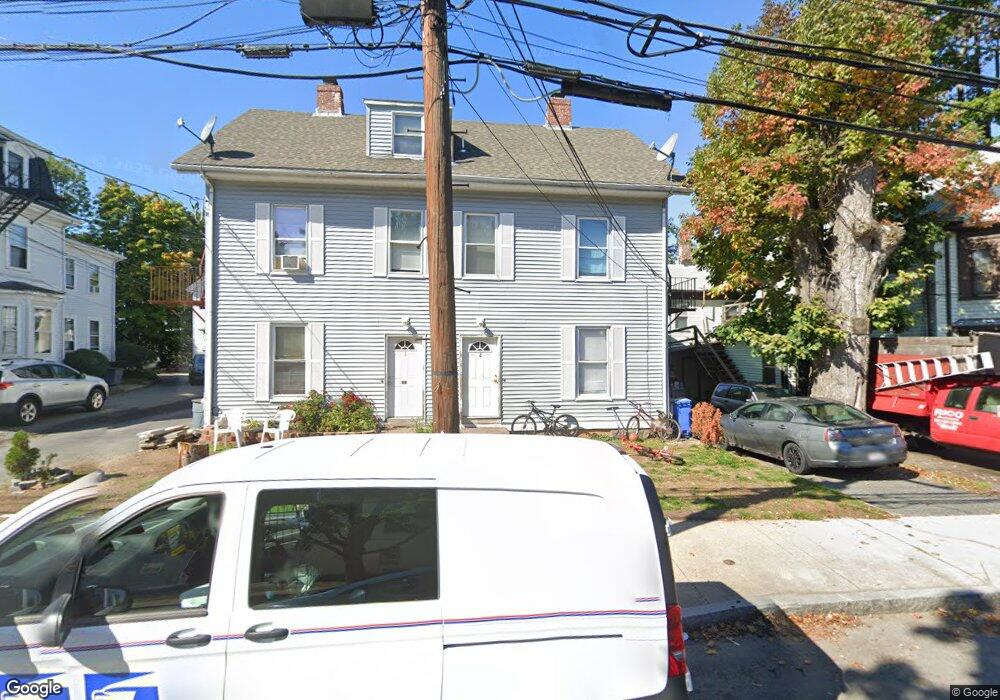
95 Crescent St Unit 97 Waltham, MA 02453
South Side NeighborhoodEstimated Value: $903,000 - $1,305,000
6
Beds
6
Baths
3,618
Sq Ft
$301/Sq Ft
Est. Value
About This Home
This home is located at 95 Crescent St Unit 97, Waltham, MA 02453 and is currently estimated at $1,089,966, approximately $301 per square foot. 95 Crescent St Unit 97 is a home located in Middlesex County with nearby schools including William F. Stanley Elementary School, John W. Mcdevitt Middle School, and Waltham Sr High School.
Ownership History
Date
Name
Owned For
Owner Type
Purchase Details
Closed on
Feb 23, 2011
Sold by
Ford Dennis B
Bought by
95-97 Crescent Rt
Current Estimated Value
Purchase Details
Closed on
Nov 22, 2002
Sold by
Lukose Johnson C and Johnson Celin J
Bought by
Ford Dennis B
Home Financials for this Owner
Home Financials are based on the most recent Mortgage that was taken out on this home.
Original Mortgage
$336,000
Interest Rate
6.07%
Mortgage Type
Commercial
Purchase Details
Closed on
Aug 27, 1993
Sold by
Main St Bldg Mgt Corp
Bought by
Lukose Johnson C
Home Financials for this Owner
Home Financials are based on the most recent Mortgage that was taken out on this home.
Original Mortgage
$160,200
Interest Rate
7.06%
Mortgage Type
Commercial
Purchase Details
Closed on
Oct 6, 1992
Sold by
Macdonald Rt
Bought by
Main St Bldg Mgmt Corp
Create a Home Valuation Report for This Property
The Home Valuation Report is an in-depth analysis detailing your home's value as well as a comparison with similar homes in the area
Home Values in the Area
Average Home Value in this Area
Purchase History
| Date | Buyer | Sale Price | Title Company |
|---|---|---|---|
| 95-97 Crescent Rt | -- | -- | |
| Ford Dennis B | $420,000 | -- | |
| Lukose Johnson C | $178,000 | -- | |
| Main St Bldg Mgmt Corp | $183,000 | -- |
Source: Public Records
Mortgage History
| Date | Status | Borrower | Loan Amount |
|---|---|---|---|
| Previous Owner | Ford Dennis B | $336,000 | |
| Previous Owner | Main St Bldg Mgmt Corp | $216,000 | |
| Previous Owner | Main St Bldg Mgmt Corp | $160,200 | |
| Previous Owner | Main St Bldg Mgmt Corp | $40,000 |
Source: Public Records
Tax History Compared to Growth
Tax History
| Year | Tax Paid | Tax Assessment Tax Assessment Total Assessment is a certain percentage of the fair market value that is determined by local assessors to be the total taxable value of land and additions on the property. | Land | Improvement |
|---|---|---|---|---|
| 2025 | $9,795 | $997,500 | $334,900 | $662,600 |
| 2024 | $8,966 | $930,100 | $334,900 | $595,200 |
| 2023 | $9,027 | $874,700 | $305,100 | $569,600 |
| 2022 | $9,185 | $824,500 | $278,600 | $545,900 |
| 2021 | $8,642 | $763,400 | $252,000 | $511,400 |
| 2020 | $8,542 | $714,800 | $238,800 | $476,000 |
| 2019 | $7,911 | $624,900 | $236,400 | $388,500 |
| 2018 | $7,122 | $564,800 | $218,900 | $345,900 |
| 2017 | $6,844 | $544,900 | $199,000 | $345,900 |
| 2016 | $6,386 | $521,700 | $175,800 | $345,900 |
| 2015 | $6,029 | $459,200 | $172,400 | $286,800 |
Source: Public Records
Map
Nearby Homes
- 85 Crescent St
- 55-57 Crescent St
- 61 Hall St Unit 1
- 61 Hall St Unit 9
- 61 Hall St Unit 2
- 61 Hall St Unit 7
- 15 Alder St Unit 1
- 39 Floyd St Unit 2
- 7-11.5 Felton
- 42 Alder St
- 32 Harvard St Unit 2
- 47 Alder St Unit 6
- 40 Myrtle St Unit 9
- 81 Alder St
- 73 Orange St Unit 2
- 15 Howard St
- 312 Newton St Unit 1A
- 31-37 Washington Ave
- 308 Newton St Unit 1
- 160 School St Unit 3-1
- 95 Crescent St
- 99 Crescent St
- 91 Crescent St Unit 93
- 101 Crescent St Unit 103
- 107 Crescent St
- 107 Crescent St Unit 2
- 107 Crescent St Unit 1
- 92 Crescent St
- 104 Crescent St
- 104 Crescent St
- 104 Crescent St Unit 1
- 104 Crescent St
- 104 Crescent St Unit 2
- 104 Crescent St Unit 104
- 12 Walnut St
- 12 Walnut St Unit 1
- 12 Walnut St Unit U
- 7 Walnut St
- 77 Crescent St
- 113 Crescent St