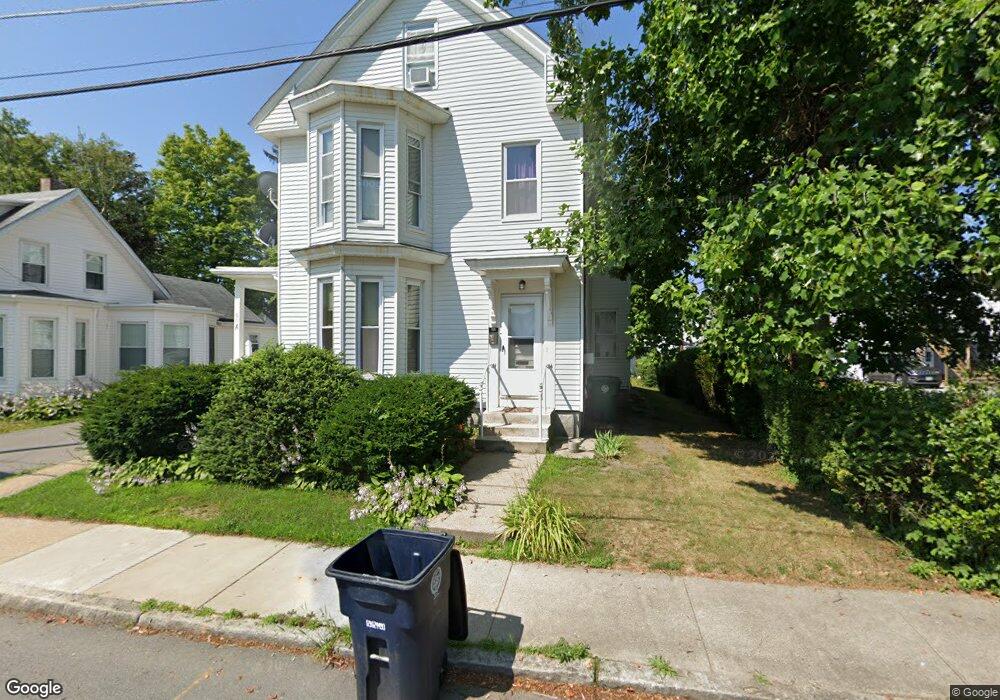
95 Elm St Nashua, NH 03060
Downtown Nashua NeighborhoodEstimated Value: $484,074 - $572,000
15
Beds
3
Baths
3,469
Sq Ft
$157/Sq Ft
Est. Value
About This Home
This home is located at 95 Elm St, Nashua, NH 03060 and is currently estimated at $544,769, approximately $157 per square foot. 95 Elm St is a home located in Hillsborough County with nearby schools including Fairgrounds Elementary School, Elm Street Middle School, and Nashua High School South.
Ownership History
Date
Name
Owned For
Owner Type
Purchase Details
Closed on
Apr 15, 2024
Sold by
K-N-A Properties Llc
Bought by
Martinez Residence Llc
Current Estimated Value
Purchase Details
Closed on
Sep 24, 2004
Sold by
Dow Bradford J
Bought by
Eberhardt Anthony J
Home Financials for this Owner
Home Financials are based on the most recent Mortgage that was taken out on this home.
Original Mortgage
$212,000
Interest Rate
5.89%
Mortgage Type
Purchase Money Mortgage
Purchase Details
Closed on
May 31, 2001
Sold by
Lheureux Richard A
Bought by
Karlsen Kare and Karlsen Anne
Home Financials for this Owner
Home Financials are based on the most recent Mortgage that was taken out on this home.
Original Mortgage
$70,000
Interest Rate
7.09%
Mortgage Type
Purchase Money Mortgage
Create a Home Valuation Report for This Property
The Home Valuation Report is an in-depth analysis detailing your home's value as well as a comparison with similar homes in the area
Home Values in the Area
Average Home Value in this Area
Purchase History
| Date | Buyer | Sale Price | Title Company |
|---|---|---|---|
| Martinez Residence Llc | $475,000 | None Available | |
| Martinez Residence Llc | $475,000 | None Available | |
| Eberhardt Anthony J | $265,000 | -- | |
| Eberhardt Anthony J | $265,000 | -- | |
| Karlsen Kare | $115,100 | -- | |
| Karlsen Kare | $115,100 | -- |
Source: Public Records
Mortgage History
| Date | Status | Borrower | Loan Amount |
|---|---|---|---|
| Previous Owner | Karlsen Kare | $212,000 | |
| Previous Owner | Karlsen Kare | $70,000 |
Source: Public Records
Tax History Compared to Growth
Tax History
| Year | Tax Paid | Tax Assessment Tax Assessment Total Assessment is a certain percentage of the fair market value that is determined by local assessors to be the total taxable value of land and additions on the property. | Land | Improvement |
|---|---|---|---|---|
| 2024 | $8,774 | $551,800 | $138,700 | $413,100 |
| 2023 | $8,581 | $470,700 | $110,900 | $359,800 |
| 2022 | $8,506 | $470,700 | $110,900 | $359,800 |
| 2021 | $7,080 | $304,900 | $74,000 | $230,900 |
| 2020 | $6,860 | $303,400 | $74,000 | $229,400 |
| 2019 | $6,602 | $303,400 | $74,000 | $229,400 |
| 2018 | $6,435 | $303,400 | $74,000 | $229,400 |
| 2017 | $5,594 | $216,900 | $70,400 | $146,500 |
| 2016 | $5,468 | $218,100 | $70,400 | $147,700 |
| 2015 | $5,350 | $218,100 | $70,400 | $147,700 |
| 2014 | $5,245 | $218,100 | $70,400 | $147,700 |
Source: Public Records
Map
Nearby Homes
- 8 Buck St Unit 10
- 24 E Otterson St
- 71 Vine St Unit 713/4
- 121 Palm St
- 15 Lovell St Unit 20
- 15 Lovell St Unit 3
- 15 Lovell St Unit 10
- 29 Wilder St
- 38 Central St
- 30 Ledge St
- 4 Badger St
- 4 Haines St Unit 56
- 4 1/2 Haines St
- 13 Mulvanity St
- 19.5 Balcom St
- 1 Circle Ave
- 19 King St Unit 87
- 10 Zellwood St
- 52 Main St Unit 402
- 6 Lake Ave