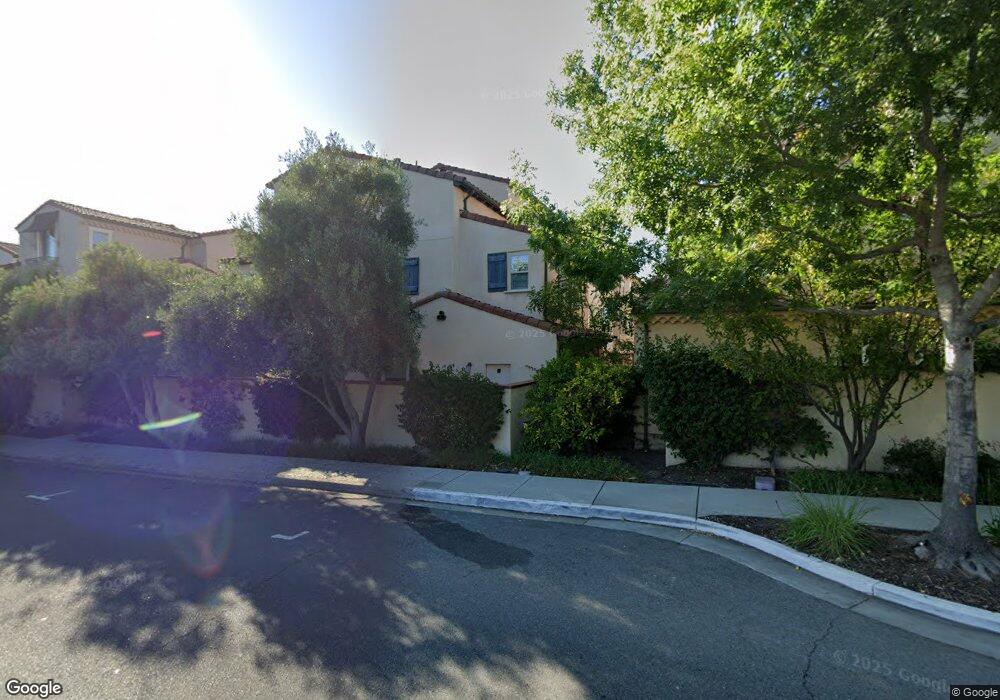
95 Goodman Ln Milpitas, CA 95035
Estimated Value: $1,745,000 - $1,988,024
4
Beds
4
Baths
2,284
Sq Ft
$825/Sq Ft
Est. Value
About This Home
This home is located at 95 Goodman Ln, Milpitas, CA 95035 and is currently estimated at $1,883,256, approximately $824 per square foot. 95 Goodman Ln is a home with nearby schools including Robert Randall Elementary School, Alexander Rose Elementary School, and Rancho Milpitas Middle School.
Ownership History
Date
Name
Owned For
Owner Type
Purchase Details
Closed on
Aug 26, 2024
Sold by
Loong Chong Christopher Kok and Sze Fu Yeuk
Bought by
Christopher Kok Loong Chong and Christopher Yeuk Sze
Current Estimated Value
Purchase Details
Closed on
Sep 24, 2013
Sold by
Robson Homes Llc
Bought by
Chong Christopher and Szefu Yeuk
Home Financials for this Owner
Home Financials are based on the most recent Mortgage that was taken out on this home.
Original Mortgage
$625,500
Interest Rate
4.55%
Mortgage Type
New Conventional
Create a Home Valuation Report for This Property
The Home Valuation Report is an in-depth analysis detailing your home's value as well as a comparison with similar homes in the area
Home Values in the Area
Average Home Value in this Area
Purchase History
We collect this data history from publicly available records. To have your information removed, we recommend requesting removal directly through your county’s website.
| Date | Buyer | Sale Price | Title Company |
|---|---|---|---|
| Christopher Kok Loong Chong | -- | None Listed On Document | |
| Chong Christopher | $836,750 | First American Title Company |
Source: Public Records
Mortgage History
We collect this data history from publicly available records. To have your information removed, we recommend requesting removal directly through your county’s website.
| Date | Status | Borrower | Loan Amount |
|---|---|---|---|
| Previous Owner | Chong Christopher | $625,500 |
Source: Public Records
Tax History
| Year | Tax Paid | Tax Assessment Tax Assessment Total Assessment is a certain percentage of the fair market value that is determined by local assessors to be the total taxable value of land and additions on the property. | Land | Improvement |
|---|---|---|---|---|
| 2025 | $12,304 | $1,025,732 | $512,866 | $512,866 |
| 2024 | $12,304 | $1,005,620 | $502,810 | $502,810 |
| 2023 | $12,255 | $985,902 | $492,951 | $492,951 |
| 2022 | $12,180 | $966,572 | $483,286 | $483,286 |
| 2021 | $11,987 | $947,620 | $473,810 | $473,810 |
| 2020 | $11,777 | $937,904 | $468,952 | $468,952 |
| 2019 | $11,635 | $919,514 | $459,757 | $459,757 |
| 2018 | $11,054 | $901,486 | $450,743 | $450,743 |
| 2017 | $10,903 | $883,810 | $441,905 | $441,905 |
| 2016 | $10,467 | $866,482 | $433,241 | $433,241 |
| 2015 | $10,353 | $853,468 | $426,734 | $426,734 |
| 2014 | $10,003 | $836,750 | $418,375 | $418,375 |
Source: Public Records
Map
Nearby Homes
- 908 Smith Ln
- 1163 Park Grove Dr
- 375 Dempsey Rd
- 476 Dempsey Rd Unit 277
- 397 S Park Victoria Dr
- 436 Dempsey Rd Unit 238
- 642 Aberdeen Way
- 63 Chysis Rd
- 545 Printy Ave
- 131 Caladenia Ln
- 160 Roswell Dr
- 1260 Glacier Dr
- 1394 Glacier Dr
- 1402 Stemel Way
- 613 Parvin Dr
- 0 Railroad Ave
- 1490 Olympic Dr
- 7280 Marylinn Dr
- 35 Terfidia Ln
- 668 Erie Cir
Your Personal Tour Guide
Ask me questions while you tour the home.