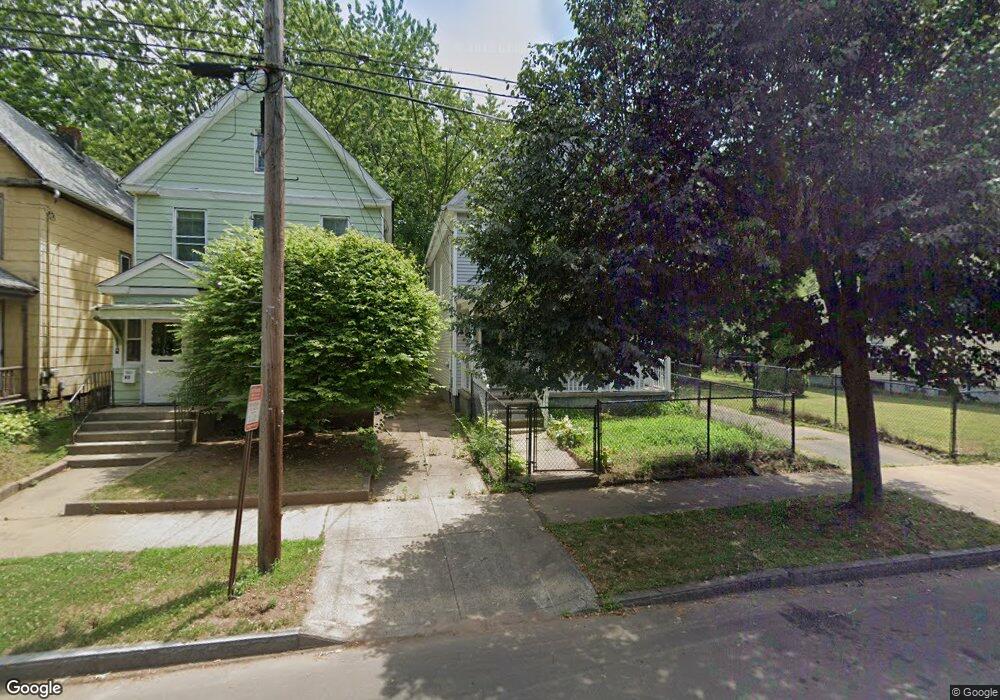
95 Goodyear St New Haven, CT 06511
Newhallville NeighborhoodEstimated Value: $294,000 - $359,000
3
Beds
2
Baths
1,680
Sq Ft
$200/Sq Ft
Est. Value
About This Home
This home is located at 95 Goodyear St, New Haven, CT 06511 and is currently estimated at $336,603, approximately $200 per square foot. 95 Goodyear St is a home located in New Haven County with nearby schools including Highville Charter School, The Foote School, and Cedarhurst School.
Ownership History
Date
Name
Owned For
Owner Type
Purchase Details
Closed on
Nov 2, 2007
Sold by
Baham Investments Llc
Bought by
Gordon Denise
Current Estimated Value
Home Financials for this Owner
Home Financials are based on the most recent Mortgage that was taken out on this home.
Original Mortgage
$178,589
Interest Rate
6.43%
Purchase Details
Closed on
Apr 12, 2007
Sold by
Cummings Francis and Cummings Thomas
Bought by
Baham Investments Llc
Create a Home Valuation Report for This Property
The Home Valuation Report is an in-depth analysis detailing your home's value as well as a comparison with similar homes in the area
Home Values in the Area
Average Home Value in this Area
Purchase History
| Date | Buyer | Sale Price | Title Company |
|---|---|---|---|
| Gordon Denise | $180,000 | -- | |
| Baham Investments Llc | $55,000 | -- |
Source: Public Records
Mortgage History
| Date | Status | Borrower | Loan Amount |
|---|---|---|---|
| Open | Baham Investments Llc | $174,096 | |
| Closed | Baham Investments Llc | $178,589 | |
| Closed | Baham Investments Llc | $9,950 |
Source: Public Records
Tax History Compared to Growth
Tax History
| Year | Tax Paid | Tax Assessment Tax Assessment Total Assessment is a certain percentage of the fair market value that is determined by local assessors to be the total taxable value of land and additions on the property. | Land | Improvement |
|---|---|---|---|---|
| 2025 | $5,566 | $141,260 | $34,720 | $106,540 |
| 2024 | $5,439 | $141,260 | $34,720 | $106,540 |
| 2023 | $5,255 | $141,260 | $34,720 | $106,540 |
| 2022 | $5,615 | $141,260 | $34,720 | $106,540 |
| 2021 | $3,511 | $80,010 | $27,720 | $52,290 |
| 2020 | $3,511 | $80,010 | $27,720 | $52,290 |
| 2019 | $3,439 | $80,010 | $27,720 | $52,290 |
| 2018 | $3,439 | $80,010 | $27,720 | $52,290 |
| 2017 | $3,095 | $80,010 | $27,720 | $52,290 |
| 2016 | $2,635 | $63,420 | $12,320 | $51,100 |
| 2015 | $2,635 | $63,420 | $12,320 | $51,100 |
| 2014 | $2,635 | $63,420 | $12,320 | $51,100 |
Source: Public Records
Map
Nearby Homes
- 89 Goodyear St
- 99 Goodyear St
- 159 Read St
- 155 Read St
- 163 Read St
- 103 Goodyear St
- 147 Read St
- 394 Shelton Ave Unit 1
- 398 Shelton Ave
- 6 Daisy St
- 402 Shelton Ave
- 74 Goodyear St
- 74 Goodyear St Unit 2
- 74 Goodyear St Unit 1
- 390 Shelton Ave
- 406 Shelton Ave
- 406 Shelton Ave Unit 1
- 76 Goodyear St
- 402 Shelton Ave