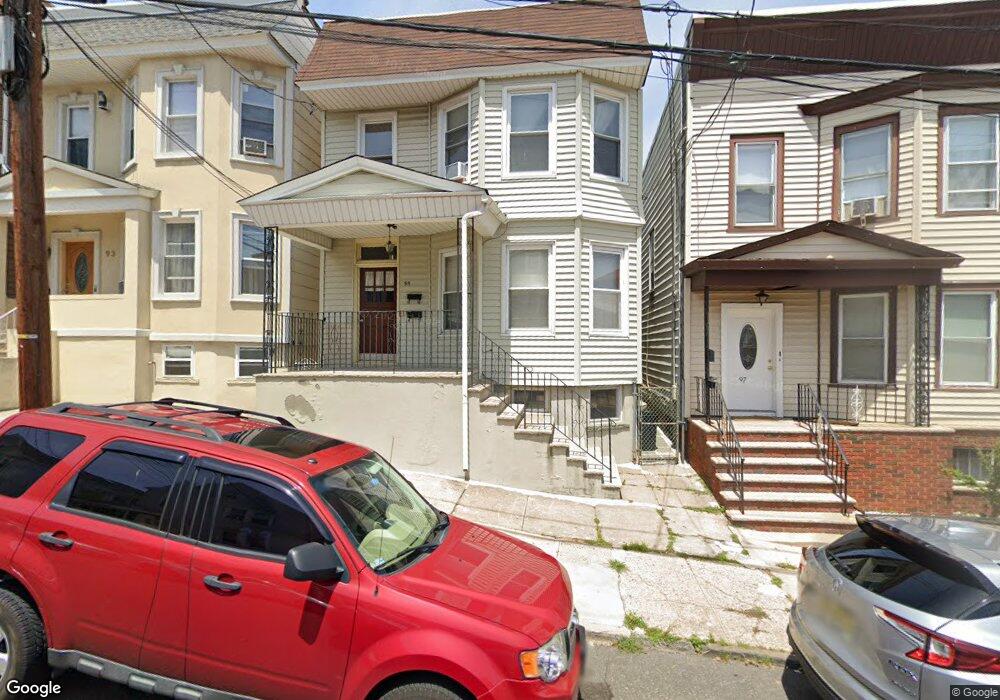
95 Hoyt St Kearny, NJ 07032
Estimated Value: $446,582 - $698,000
--
Bed
--
Bath
2,240
Sq Ft
$267/Sq Ft
Est. Value
About This Home
This home is located at 95 Hoyt St, Kearny, NJ 07032 and is currently estimated at $598,646, approximately $267 per square foot. 95 Hoyt St is a home located in Hudson County with nearby schools including Kearny High School and Kearny Christian Academy.
Ownership History
Date
Name
Owned For
Owner Type
Purchase Details
Closed on
Aug 27, 2015
Sold by
Murillo Victor and Murillo Sonia
Bought by
Zhuang Xue Kun and Wong Oi Ping
Current Estimated Value
Home Financials for this Owner
Home Financials are based on the most recent Mortgage that was taken out on this home.
Original Mortgage
$100,000
Outstanding Balance
$38,761
Interest Rate
3.19%
Mortgage Type
New Conventional
Estimated Equity
$559,885
Purchase Details
Closed on
Nov 11, 2001
Sold by
Ferreira Manuel and Ferreira Maria
Bought by
Hud
Create a Home Valuation Report for This Property
The Home Valuation Report is an in-depth analysis detailing your home's value as well as a comparison with similar homes in the area
Home Values in the Area
Average Home Value in this Area
Purchase History
| Date | Buyer | Sale Price | Title Company |
|---|---|---|---|
| Zhuang Xue Kun | $305,000 | Title Insurance Commitment | |
| Hud | -- | -- |
Source: Public Records
Mortgage History
| Date | Status | Borrower | Loan Amount |
|---|---|---|---|
| Open | Zhuang Xue Kun | $100,000 |
Source: Public Records
Tax History Compared to Growth
Tax History
| Year | Tax Paid | Tax Assessment Tax Assessment Total Assessment is a certain percentage of the fair market value that is determined by local assessors to be the total taxable value of land and additions on the property. | Land | Improvement |
|---|---|---|---|---|
| 2025 | $10,095 | $94,300 | $16,100 | $78,200 |
| 2024 | $9,965 | $94,300 | $16,100 | $78,200 |
| 2023 | $9,965 | $94,300 | $16,100 | $78,200 |
| 2022 | $9,941 | $94,300 | $16,100 | $78,200 |
| 2021 | $9,887 | $94,300 | $16,100 | $78,200 |
| 2020 | $9,892 | $94,300 | $16,100 | $78,200 |
| 2019 | $9,941 | $94,300 | $16,100 | $78,200 |
| 2018 | $9,959 | $94,300 | $16,100 | $78,200 |
| 2017 | $10,095 | $94,300 | $16,100 | $78,200 |
| 2016 | $10,061 | $94,300 | $16,100 | $78,200 |
| 2015 | $9,737 | $88,700 | $16,100 | $72,600 |
| 2014 | $8,902 | $88,700 | $16,100 | $72,600 |
Source: Public Records
Map
Nearby Homes