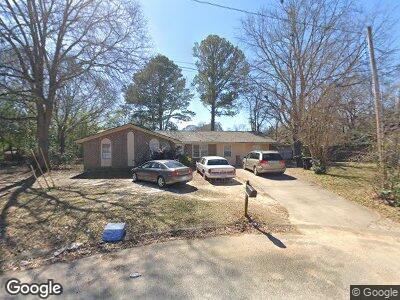
95 Knightsvue Place Warner Robins, GA 31093
Estimated Value: $141,198 - $176,000
--
Bed
2
Baths
1,710
Sq Ft
$93/Sq Ft
Est. Value
About This Home
This home is located at 95 Knightsvue Place, Warner Robins, GA 31093 and is currently estimated at $159,550, approximately $93 per square foot. 95 Knightsvue Place is a home located in Houston County with nearby schools including Parkwood Elementary School, Northside Middle School, and Northside High School.
Ownership History
Date
Name
Owned For
Owner Type
Purchase Details
Closed on
Sep 10, 2007
Sold by
Vrocher Walter E
Bought by
Brown Charlie J and Brown Lillie M
Current Estimated Value
Home Financials for this Owner
Home Financials are based on the most recent Mortgage that was taken out on this home.
Original Mortgage
$79,000
Interest Rate
6.62%
Mortgage Type
New Conventional
Purchase Details
Closed on
Mar 15, 2004
Sold by
Jordan Garr L and Karen S*
Bought by
Vrocher Walter E
Purchase Details
Closed on
Dec 1, 1989
Sold by
Merriman David R and Merriman Annette M
Bought by
Jordan Garr L and Karen S*
Purchase Details
Closed on
May 8, 1978
Sold by
Izzo Frank and Izzo Sharon A
Bought by
Merriman David R and Merriman Annette M
Purchase Details
Closed on
Jun 4, 1976
Sold by
Izzo Frank
Bought by
Izzo Frank and Izzo Sharon A
Purchase Details
Closed on
Nov 27, 1973
Sold by
Dixie Delta Corp
Bought by
Jackson Edward Eugene and Jackson Ann E
Create a Home Valuation Report for This Property
The Home Valuation Report is an in-depth analysis detailing your home's value as well as a comparison with similar homes in the area
Home Values in the Area
Average Home Value in this Area
Purchase History
| Date | Buyer | Sale Price | Title Company |
|---|---|---|---|
| Brown Charlie J | $79,000 | None Available | |
| Vrocher Walter E | $75,000 | -- | |
| Jordan Garr L | $49,900 | -- | |
| Merriman David R | -- | -- | |
| Izzo Frank | -- | -- | |
| Jackson Edward Eugene | $24,800 | -- |
Source: Public Records
Mortgage History
| Date | Status | Borrower | Loan Amount |
|---|---|---|---|
| Closed | Brown Lillie N | $22,625 | |
| Open | Brown Charlie J | $76,800 | |
| Closed | Brown Charlie J | $79,000 |
Source: Public Records
Tax History Compared to Growth
Tax History
| Year | Tax Paid | Tax Assessment Tax Assessment Total Assessment is a certain percentage of the fair market value that is determined by local assessors to be the total taxable value of land and additions on the property. | Land | Improvement |
|---|---|---|---|---|
| 2024 | $1,297 | $46,000 | $4,800 | $41,200 |
| 2023 | $1,044 | $38,040 | $4,800 | $33,240 |
| 2022 | $594 | $35,000 | $4,800 | $30,200 |
| 2021 | $513 | $31,320 | $4,800 | $26,520 |
| 2020 | $515 | $31,320 | $4,800 | $26,520 |
| 2019 | $515 | $31,320 | $4,800 | $26,520 |
| 2018 | $515 | $31,320 | $4,800 | $26,520 |
| 2017 | $516 | $31,320 | $4,800 | $26,520 |
| 2016 | $516 | $31,320 | $4,800 | $26,520 |
| 2015 | -- | $31,320 | $4,800 | $26,520 |
| 2014 | -- | $31,320 | $4,800 | $26,520 |
| 2013 | -- | $31,320 | $4,800 | $26,520 |
Source: Public Records
Map
Nearby Homes
- 95 Knightsvue Place
- 96 Knightsvue Place
- 97 Knightsvue Place
- 225 Ravenwood Way
- 227 Ravenwood Way
- 223 Ravenwood Way
- 229 Ravenwood Way
- 99 Knightsvue Place
- 98 Knightsvue Place
- 116 W Imperial Cir
- 221 Ravenwood Way
- 231 Ravenwood Way
- 101 Knightsvue Place
- 114 W Imperial Cir
- 100 Knightsvue Place
- 219 Ravenwood Way
- 112 W Imperial Cir
- 121 Mockingbird Ln
- 103 Knightsvue Place
- 102 Knightsvue Place