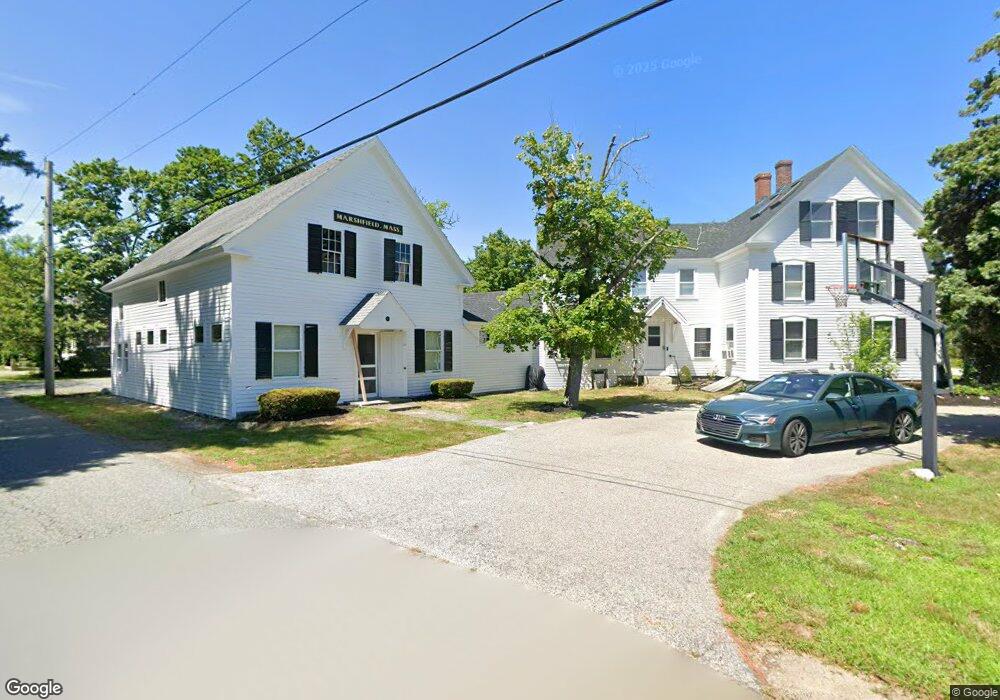
95 Main St Marshfield, MA 02050
Estimated Value: $672,000 - $1,146,000
5
Beds
4
Baths
3,453
Sq Ft
$274/Sq Ft
Est. Value
About This Home
This home is located at 95 Main St, Marshfield, MA 02050 and is currently estimated at $946,692, approximately $274 per square foot. 95 Main St is a home located in Plymouth County with nearby schools including South River, Furnace Brook Middle School, and Marshfield High School.
Ownership History
Date
Name
Owned For
Owner Type
Purchase Details
Closed on
Feb 17, 2017
Sold by
Mcdonald Reed
Bought by
Mcdonald Reed and Mcdonald Kristine
Current Estimated Value
Purchase Details
Closed on
Oct 7, 2016
Sold by
Mcdonald Joseph D and Mcdonald Madeline T
Bought by
Mcdonald Reed
Home Financials for this Owner
Home Financials are based on the most recent Mortgage that was taken out on this home.
Original Mortgage
$522,400
Interest Rate
3.43%
Mortgage Type
Stand Alone Refi Refinance Of Original Loan
Purchase Details
Closed on
Jul 30, 1999
Sold by
Thomas Robert M and Thomas Caroline D
Bought by
Gray Robert L and Gray Nancy M
Home Financials for this Owner
Home Financials are based on the most recent Mortgage that was taken out on this home.
Original Mortgage
$400,000
Interest Rate
7.61%
Mortgage Type
Purchase Money Mortgage
Create a Home Valuation Report for This Property
The Home Valuation Report is an in-depth analysis detailing your home's value as well as a comparison with similar homes in the area
Home Values in the Area
Average Home Value in this Area
Purchase History
| Date | Buyer | Sale Price | Title Company |
|---|---|---|---|
| Mcdonald Reed | -- | -- | |
| Mcdonald Reed | -- | -- | |
| Gray Robert L | $555,000 | -- |
Source: Public Records
Mortgage History
| Date | Status | Borrower | Loan Amount |
|---|---|---|---|
| Previous Owner | Mcdonald Reed | $522,400 | |
| Previous Owner | Gray Robert L | $67,300 | |
| Previous Owner | Gray Robert L | $162,000 | |
| Previous Owner | Gray Robert L | $400,000 |
Source: Public Records
Tax History
| Year | Tax Paid | Tax Assessment Tax Assessment Total Assessment is a certain percentage of the fair market value that is determined by local assessors to be the total taxable value of land and additions on the property. | Land | Improvement |
|---|---|---|---|---|
| 2025 | $7,989 | $807,000 | $304,200 | $502,800 |
| 2024 | $7,568 | $728,400 | $289,700 | $438,700 |
| 2023 | $7,685 | $670,800 | $269,000 | $401,800 |
| 2022 | $7,685 | $593,400 | $217,300 | $376,100 |
| 2021 | $6,955 | $527,300 | $215,200 | $312,100 |
| 2020 | $6,700 | $502,600 | $196,600 | $306,000 |
| 2019 | $6,725 | $502,600 | $196,600 | $306,000 |
| 2018 | $6,720 | $502,600 | $196,600 | $306,000 |
| 2017 | $6,374 | $464,600 | $186,200 | $278,400 |
| 2016 | $6,306 | $454,300 | $175,900 | $278,400 |
| 2015 | $6,038 | $454,300 | $175,900 | $278,400 |
| 2014 | $5,646 | $424,800 | $161,400 | $263,400 |
Source: Public Records
Map
Nearby Homes
- 235 Main St
- 14 Ferry St
- 290 S River St
- 6 Maple Ln
- 167 Planting Field Rd
- 341 Furnace St
- 92 Salt Meadow Waye
- 3 Red Pony Path Unit 3
- 152 Acorn St
- 2 Proprietors Dr Unit 25
- 2 Proprietors Dr Unit 26
- 2 Proprietors Dr Unit 27
- 7 Pierce Rd
- 6 Hillside Ln
- 39 High Beacon Way
- 42 Carr Rd
- 3 Harlow Brook Way Unit 3
- 2 Harlow Brook Way Unit 2
- 2 Secret Pond Way Unit 35
- 1 Secret Pond Way Unit 36
Your Personal Tour Guide
Ask me questions while you tour the home.