M
Seller's Agent in 2021
Melissa Weinand
William Raveis R.E. & Home Services
(781) 254-8669
1 in this area
236 Total Sales
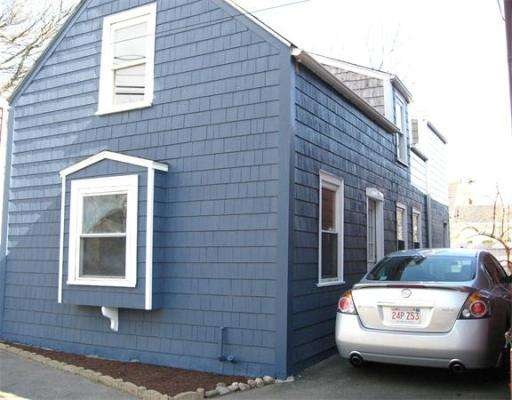
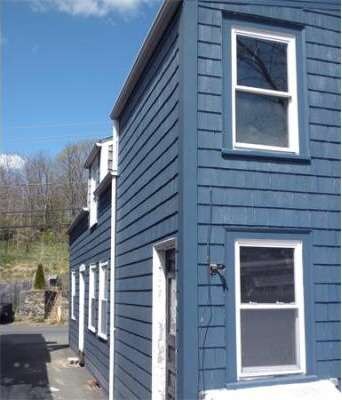
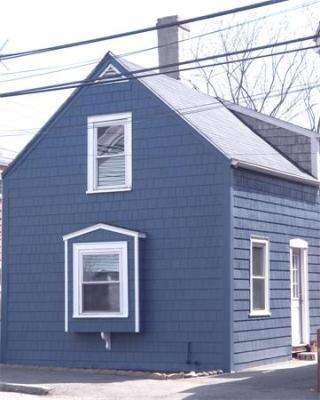

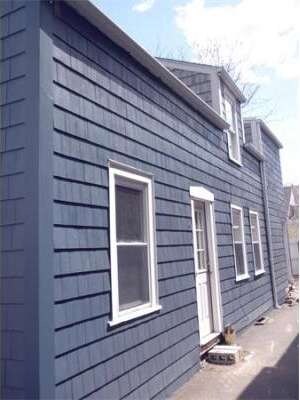
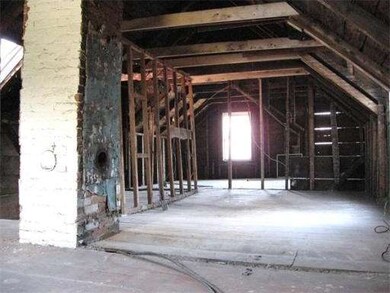
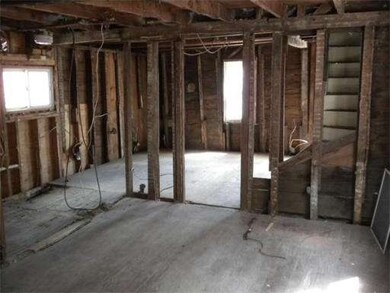
**** CONTRACTORS ONLY **** LAST GROUP SHOWING SATURDAY, 4/21 at 11:30AM. Originally a 6 room, 3 bedroom, 1 bath home, this single family colonial has been completely gutted and is ready for you to restore its original glory, or to any configuration you like! New exterior paint and partial new roof. Walking distance to the commuter train and downtown Salem. Across from Mack Park. Driveway parking for 2 cars. ** CASH OFFERS ONLY, PLEASE **
Home Type
Year Built
Lot Details
Home Design
Interior Spaces
Bedrooms and Bathrooms
Parking
Location
Utilities
Listing and Financial Details
Overview
Amenities
Recreation
| Date | Type | Sale Price | Title Company |
|---|---|---|---|
| Not Resolvable | $525,000 | None Available | |
| Not Resolvable | $298,000 | -- | |
| Not Resolvable | $271,000 | -- | |
| Deed | $74,000 | -- | |
| Foreclosure Deed | $84,150 | -- | |
| Deed | $98,000 | -- |
| Date | Status | Loan Amount | Loan Type |
|---|---|---|---|
| Open | $420,000 | Purchase Money Mortgage | |
| Previous Owner | $238,400 | New Conventional | |
| Previous Owner | $257,450 | New Conventional | |
| Previous Owner | $148,000 | No Value Available |
| Date | Event | Price | Change | Sq Ft Price |
|---|---|---|---|---|
| 06/28/2021 06/28/21 | Sold | $525,000 | +7.4% | $313 / Sq Ft |
| 05/23/2021 05/23/21 | Pending | -- | -- | -- |
| 05/20/2021 05/20/21 | For Sale | $489,000 | +64.1% | $291 / Sq Ft |
| 03/19/2015 03/19/15 | Sold | $298,000 | 0.0% | $177 / Sq Ft |
| 02/26/2015 02/26/15 | Pending | -- | -- | -- |
| 02/10/2015 02/10/15 | Off Market | $298,000 | -- | -- |
| 02/06/2015 02/06/15 | Price Changed | $299,000 | 0.0% | $178 / Sq Ft |
| 02/06/2015 02/06/15 | For Sale | $299,000 | +0.3% | $178 / Sq Ft |
| 02/03/2015 02/03/15 | Off Market | $298,000 | -- | -- |
| 01/21/2015 01/21/15 | Price Changed | $304,000 | -1.6% | $181 / Sq Ft |
| 01/05/2015 01/05/15 | Price Changed | $309,000 | -1.6% | $184 / Sq Ft |
| 11/18/2014 11/18/14 | For Sale | $314,000 | +15.9% | $187 / Sq Ft |
| 10/16/2012 10/16/12 | Sold | $271,000 | +0.7% | $161 / Sq Ft |
| 10/16/2012 10/16/12 | Pending | -- | -- | -- |
| 08/25/2012 08/25/12 | For Sale | $269,000 | +317.1% | $160 / Sq Ft |
| 05/04/2012 05/04/12 | Sold | $64,500 | -7.2% | $65 / Sq Ft |
| 04/23/2012 04/23/12 | Pending | -- | -- | -- |
| 04/17/2012 04/17/12 | For Sale | $69,500 | -- | $70 / Sq Ft |
| Year | Tax Paid | Tax Assessment Tax Assessment Total Assessment is a certain percentage of the fair market value that is determined by local assessors to be the total taxable value of land and additions on the property. | Land | Improvement |
|---|---|---|---|---|
| 2025 | $7,325 | $645,900 | $139,600 | $506,300 |
| 2024 | $7,183 | $618,200 | $139,600 | $478,600 |
| 2023 | $7,018 | $561,000 | $123,200 | $437,800 |
| 2022 | $6,727 | $507,700 | $115,000 | $392,700 |
| 2021 | $5,802 | $420,400 | $107,300 | $313,100 |
| 2020 | $5,799 | $401,300 | $111,200 | $290,100 |
| 2019 | $5,708 | $378,000 | $101,300 | $276,700 |
| 2018 | $5,397 | $350,900 | $87,600 | $263,300 |
| 2017 | $5,045 | $318,100 | $70,100 | $248,000 |
| 2016 | $4,985 | $318,100 | $70,100 | $248,000 |
| 2015 | $4,856 | $295,900 | $60,200 | $235,700 |
M
Seller's Agent in 2021
Melissa Weinand
William Raveis R.E. & Home Services
(781) 254-8669
1 in this area
236 Total Sales

Seller Co-Listing Agent in 2021
Tyson Lynch
The Proper Nest Real Estate
(781) 244-5208
3 in this area
74 Total Sales
Buyer's Agent in 2021
Melissa Addis
Buyers Choice Realty
(617) 875-0990
1 in this area
53 Total Sales
R
Seller's Agent in 2015
Ryan Hussey
J. Barrett & Company
Buyer's Agent in 2015
Flavio Pellegrino
Keller Williams Realty Boston Northwest
Seller's Agent in 2012
David Cutler
North Shore Realty Pros
(978) 869-8042
44 Total Sales
Source: MLS Property Information Network (MLS PIN)
MLS Number: 71368520
APN: SALE-000016-000000-000347
Disclaimer: Certain information contained herein is derived from information provided by parties other than Homes.com. All information provided is deemed reliable, but is not guaranteed to be accurate and should be independently verified.
![]() The property listing data and information, or the Images, set forth herein were provided to MLS Property Information Network, Inc. from third party sources, including sellers, lessors and public records, and were compiled by MLS Property Information Network, Inc. The property listing data and information, and the Images, are for the personal, non-commercial use of consumers having a good faith interest in purchasing or leasing listed properties of the type displayed to them and may not be used for any purpose other than to identify prospective properties which such consumers may have a good faith interest in purchasing or leasing. MLS Property Information Network, Inc. and its subscribers disclaim any and all representations and warranties as to the accuracy of the property listing data and information, or as to the accuracy of any of the Images, set forth herein.
The property listing data and information, or the Images, set forth herein were provided to MLS Property Information Network, Inc. from third party sources, including sellers, lessors and public records, and were compiled by MLS Property Information Network, Inc. The property listing data and information, and the Images, are for the personal, non-commercial use of consumers having a good faith interest in purchasing or leasing listed properties of the type displayed to them and may not be used for any purpose other than to identify prospective properties which such consumers may have a good faith interest in purchasing or leasing. MLS Property Information Network, Inc. and its subscribers disclaim any and all representations and warranties as to the accuracy of the property listing data and information, or as to the accuracy of any of the Images, set forth herein.