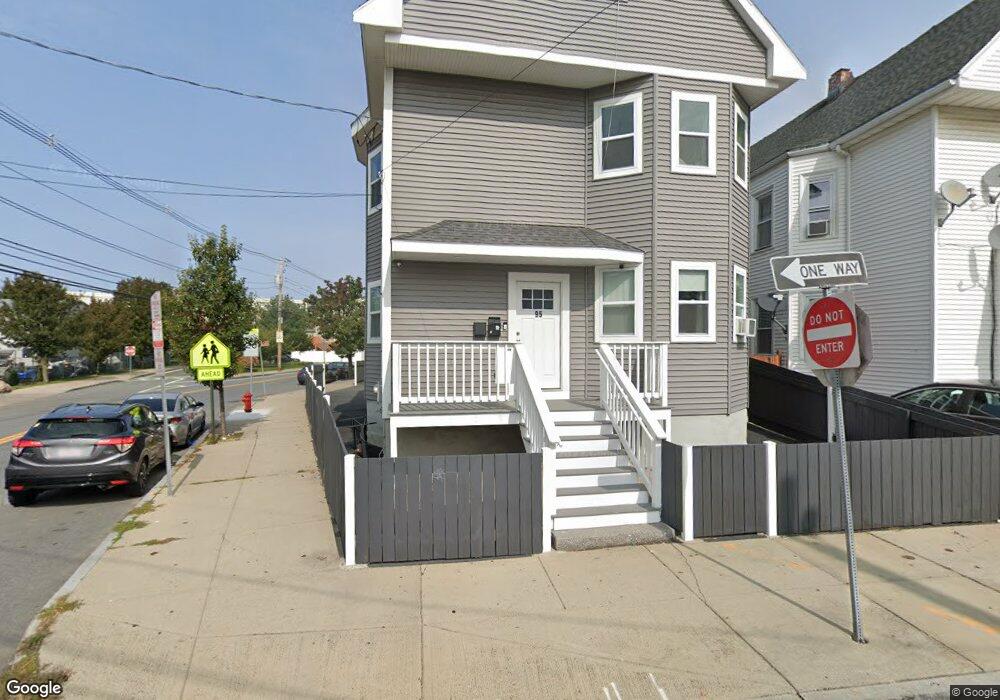
95 Pearl St Everett, MA 02149
West Everett NeighborhoodEstimated Value: $735,725 - $1,055,000
4
Beds
2
Baths
2,008
Sq Ft
$471/Sq Ft
Est. Value
About This Home
This home is located at 95 Pearl St, Everett, MA 02149 and is currently estimated at $945,931, approximately $471 per square foot. 95 Pearl St is a home located in Middlesex County with nearby schools including Everett High School, Pioneer Charter School of Science, and St Anthony School.
Ownership History
Date
Name
Owned For
Owner Type
Purchase Details
Closed on
Nov 21, 2018
Sold by
Everett City Of
Bought by
95 Pearl Street Llc
Current Estimated Value
Purchase Details
Closed on
Nov 9, 2018
Sold by
95 Pearl Street Llc
Bought by
Dehuang Zeng and Yeng Yua E
Purchase Details
Closed on
Feb 28, 2018
Sold by
Bacigalupo Frank
Bought by
95 Pearl Street Llc
Purchase Details
Closed on
Oct 3, 2016
Sold by
Bacigalupo Frank
Bought by
95 Pearl Street Llc
Purchase Details
Closed on
May 6, 2010
Sold by
Est Mitchell Bernard and Synan James M
Bought by
Bacigalupo Frank
Home Financials for this Owner
Home Financials are based on the most recent Mortgage that was taken out on this home.
Original Mortgage
$32,685
Interest Rate
5.03%
Mortgage Type
Purchase Money Mortgage
Create a Home Valuation Report for This Property
The Home Valuation Report is an in-depth analysis detailing your home's value as well as a comparison with similar homes in the area
Home Values in the Area
Average Home Value in this Area
Purchase History
We collect this data history from publicly available records. To have your information removed, we recommend requesting removal directly through your county’s website.
| Date | Buyer | Sale Price | Title Company |
|---|---|---|---|
| 95 Pearl Street Llc | -- | -- | |
| Dehuang Zeng | $750,000 | -- | |
| 95 Pearl Street Llc | -- | -- | |
| 95 Pearl Street Llc | $345,000 | -- | |
| Bacigalupo Frank | $32,684 | -- |
Source: Public Records
Mortgage History
We collect this data history from publicly available records. To have your information removed, we recommend requesting removal directly through your county’s website.
| Date | Status | Borrower | Loan Amount |
|---|---|---|---|
| Previous Owner | Bacigalupo Frank | $32,685 |
Source: Public Records
Tax History
| Year | Tax Paid | Tax Assessment Tax Assessment Total Assessment is a certain percentage of the fair market value that is determined by local assessors to be the total taxable value of land and additions on the property. | Land | Improvement |
|---|---|---|---|---|
| 2025 | $9,631 | $845,600 | $239,900 | $605,700 |
| 2024 | $8,652 | $755,000 | $194,800 | $560,200 |
| 2023 | $8,439 | $716,400 | $185,300 | $531,100 |
| 2022 | $6,959 | $671,700 | $178,600 | $493,100 |
| 2021 | $6,453 | $653,800 | $178,600 | $475,200 |
| 2020 | $6,789 | $638,100 | $178,600 | $459,500 |
| 2019 | $4,536 | $366,400 | $170,100 | $196,300 |
| 2018 | $6,015 | $436,500 | $148,200 | $288,300 |
| 2017 | $5,568 | $385,600 | $123,500 | $262,100 |
| 2016 | $5,026 | $347,800 | $114,000 | $233,800 |
| 2015 | $4,767 | $326,300 | $107,100 | $219,200 |
Source: Public Records
Map
Nearby Homes
- 59 Woodville St
- 16 Woodville St
- 120 Wyllis Ave Unit 403
- 120 Wyllis Ave Unit 103
- 19 Bradford St
- 17 Dyer Ave
- 103 Newman Rd Unit 7
- 71 Winslow St
- 233 Main St
- 80 Main St Unit 9
- 80 Main St Unit 4
- 39 Parlin St Unit 503
- 39 Parlin St Unit 207
- 39 Parlin St Unit 203
- 68 Linden St Unit 49
- 24 Wigglesworth St
- 7 2nd St
- 77 Swan St
- 41 Winthrop St
- 15 Dean St
Your Personal Tour Guide
Ask me questions while you tour the home.