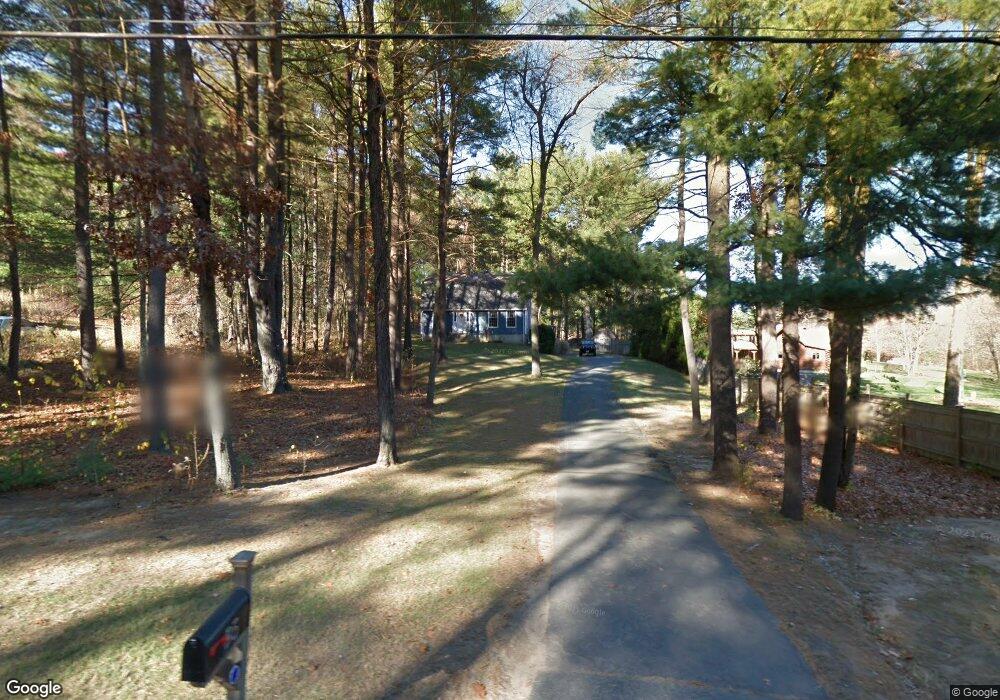
95 Pomeroy St Easthampton, MA 01027
Estimated Value: $472,000 - $512,000
4
Beds
3
Baths
1,872
Sq Ft
$259/Sq Ft
Est. Value
About This Home
This home is located at 95 Pomeroy St, Easthampton, MA 01027 and is currently estimated at $485,523, approximately $259 per square foot. 95 Pomeroy St is a home located in Hampshire County with nearby schools including Easthampton High School, Calvary Baptist Christian School, and Tri-County Schools.
Ownership History
Date
Name
Owned For
Owner Type
Purchase Details
Closed on
Aug 15, 2011
Sold by
Shea Elaine M
Bought by
Vallas Nicholas D and Vallas Chanon E
Current Estimated Value
Home Financials for this Owner
Home Financials are based on the most recent Mortgage that was taken out on this home.
Original Mortgage
$253,085
Outstanding Balance
$174,742
Interest Rate
4.51%
Mortgage Type
Purchase Money Mortgage
Estimated Equity
$310,781
Purchase Details
Closed on
Nov 13, 1998
Sold by
Borsuk James E and Borsuk James M
Bought by
Shea Dennis M and Shea Elaine M
Home Financials for this Owner
Home Financials are based on the most recent Mortgage that was taken out on this home.
Original Mortgage
$40,000
Interest Rate
6.65%
Mortgage Type
Purchase Money Mortgage
Purchase Details
Closed on
Jun 16, 1997
Sold by
Towne Carol A and Towne Howard C
Bought by
Borsuk Irene F and Borsuk John L
Create a Home Valuation Report for This Property
The Home Valuation Report is an in-depth analysis detailing your home's value as well as a comparison with similar homes in the area
Home Values in the Area
Average Home Value in this Area
Purchase History
| Date | Buyer | Sale Price | Title Company |
|---|---|---|---|
| Vallas Nicholas D | $245,000 | -- | |
| Shea Dennis M | $132,500 | -- | |
| Borsuk Irene F | $3,500 | -- |
Source: Public Records
Mortgage History
| Date | Status | Borrower | Loan Amount |
|---|---|---|---|
| Open | Vallas Nicholas D | $253,085 | |
| Previous Owner | Borsuk Irene F | $55,300 | |
| Previous Owner | Borsuk Irene F | $40,000 | |
| Previous Owner | Borsuk Irene F | $40,000 |
Source: Public Records
Tax History
| Year | Tax Paid | Tax Assessment Tax Assessment Total Assessment is a certain percentage of the fair market value that is determined by local assessors to be the total taxable value of land and additions on the property. | Land | Improvement |
|---|---|---|---|---|
| 2025 | $5,423 | $396,700 | $121,400 | $275,300 |
| 2024 | $5,230 | $385,700 | $117,900 | $267,800 |
| 2023 | $3,747 | $255,800 | $93,300 | $162,500 |
| 2022 | $4,228 | $255,800 | $93,300 | $162,500 |
| 2021 | $4,636 | $264,300 | $93,300 | $171,000 |
| 2020 | $4,543 | $255,800 | $93,300 | $162,500 |
| 2019 | $3,902 | $252,400 | $93,300 | $159,100 |
| 2018 | $3,765 | $235,300 | $88,100 | $147,200 |
| 2017 | $3,673 | $226,600 | $84,600 | $142,000 |
| 2016 | $3,533 | $226,600 | $84,600 | $142,000 |
| 2015 | $3,433 | $226,600 | $84,600 | $142,000 |
Source: Public Records
Map
Nearby Homes
Your Personal Tour Guide
Ask me questions while you tour the home.