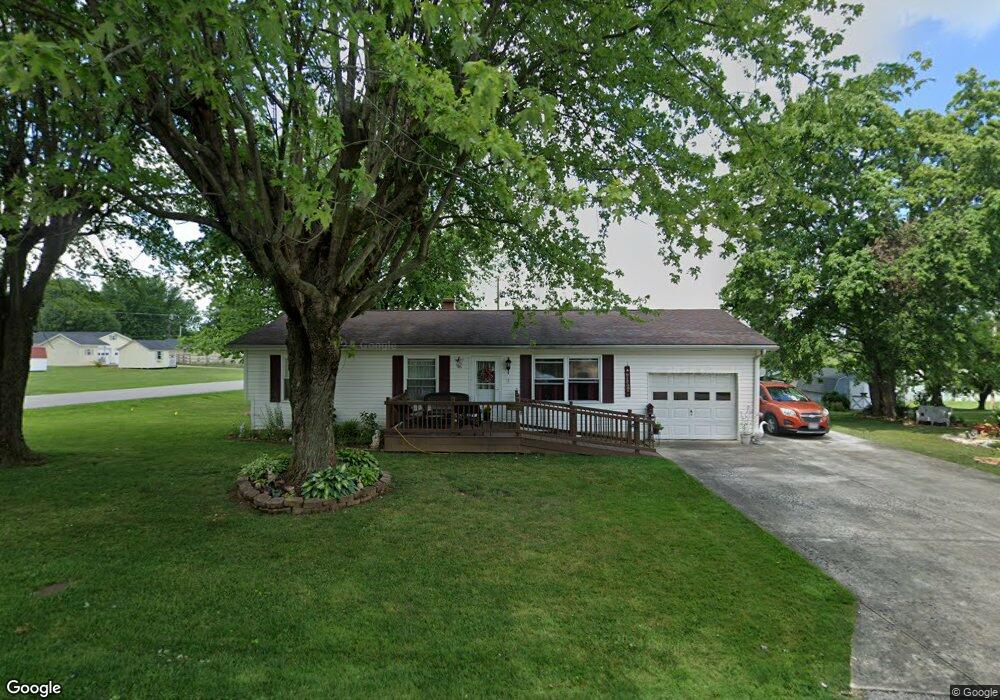
95 Randy St West Union, OH 45693
Estimated Value: $121,000 - $174,000
3
Beds
1
Bath
960
Sq Ft
$149/Sq Ft
Est. Value
About This Home
This home is located at 95 Randy St, West Union, OH 45693 and is currently estimated at $142,586, approximately $148 per square foot. 95 Randy St is a home located in Adams County with nearby schools including West Union Elementary School, West Union High School, and Adams County Christian School.
Ownership History
Date
Name
Owned For
Owner Type
Purchase Details
Closed on
Jun 10, 2015
Sold by
Myers Patricia
Bought by
Jones Sheila J
Current Estimated Value
Home Financials for this Owner
Home Financials are based on the most recent Mortgage that was taken out on this home.
Original Mortgage
$74,938
Outstanding Balance
$57,519
Interest Rate
3.5%
Mortgage Type
FHA
Estimated Equity
$85,067
Purchase Details
Closed on
Jan 31, 2011
Sold by
Reynolds Sara
Bought by
Myers Darrell and Myers Patricia
Purchase Details
Closed on
Jan 1, 1990
Bought by
Ellis Bessie L
Create a Home Valuation Report for This Property
The Home Valuation Report is an in-depth analysis detailing your home's value as well as a comparison with similar homes in the area
Home Values in the Area
Average Home Value in this Area
Purchase History
| Date | Buyer | Sale Price | Title Company |
|---|---|---|---|
| Jones Sheila J | $76,350 | None Available | |
| Myers Darrell | $35,000 | None Available | |
| Ellis Bessie L | -- | -- |
Source: Public Records
Mortgage History
| Date | Status | Borrower | Loan Amount |
|---|---|---|---|
| Open | Jones Sheila J | $74,938 |
Source: Public Records
Tax History Compared to Growth
Tax History
| Year | Tax Paid | Tax Assessment Tax Assessment Total Assessment is a certain percentage of the fair market value that is determined by local assessors to be the total taxable value of land and additions on the property. | Land | Improvement |
|---|---|---|---|---|
| 2024 | $1,127 | $30,070 | $7,700 | $22,370 |
| 2023 | $1,036 | $30,070 | $7,700 | $22,370 |
| 2022 | $1,036 | $24,090 | $5,850 | $18,240 |
| 2021 | $897 | $24,090 | $5,850 | $18,240 |
| 2020 | $918 | $24,090 | $5,850 | $18,240 |
| 2019 | $918 | $24,090 | $5,850 | $18,240 |
| 2018 | $861 | $21,710 | $5,850 | $15,860 |
| 2017 | $848 | $21,710 | $5,850 | $15,860 |
| 2016 | $847 | $21,710 | $5,850 | $15,860 |
| 2015 | $413 | $19,960 | $6,060 | $13,900 |
| 2014 | $413 | $19,960 | $6,060 | $13,900 |
Source: Public Records
Map
Nearby Homes
- 216 Kurt St
- 260 Randy St
- 1478 Robinson Hollow Rd
- 917 Logans Ln
- 3188 Ohio 125
- 618 Maple St
- 1082 E Walnut St
- 410 Owens Rd
- 902 E Walnut St
- 601 E Main St
- 725 E Walnut St
- 501 E Mulberry St
- 70 Logans Ln
- 526 E Walnut St
- 104 N Washington St
- 204 E North St
- 537 1st St
- 175 Hidden Acres Dr
- 12196 State Route 41
- 585 High St