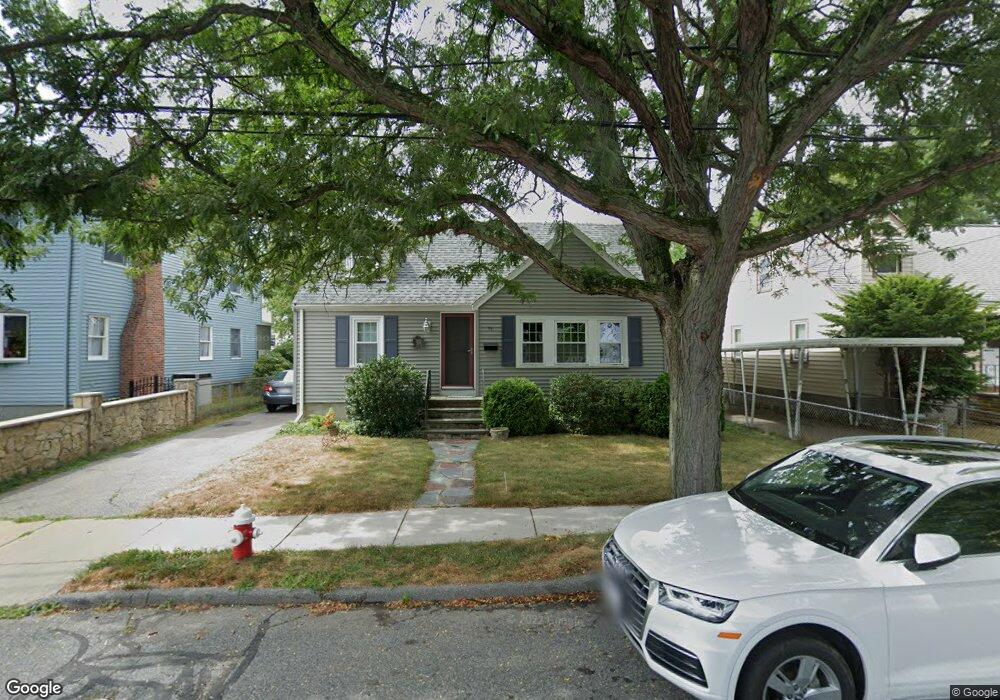
95 Rutland St Watertown, MA 02472
West Watertown NeighborhoodEstimated Value: $817,492 - $875,000
3
Beds
1
Bath
1,181
Sq Ft
$708/Sq Ft
Est. Value
About This Home
This home is located at 95 Rutland St, Watertown, MA 02472 and is currently estimated at $836,623, approximately $708 per square foot. 95 Rutland St is a home located in Middlesex County with nearby schools including Jackson Walnut Park School, JCDS, Boston's Jewish Community Day School, and Beacon High School.
Ownership History
Date
Name
Owned For
Owner Type
Purchase Details
Closed on
Dec 6, 1993
Sold by
Felt Arlene S and Corrigan Carole A
Bought by
Pyle Michael E and Jenkins Susan M
Current Estimated Value
Home Financials for this Owner
Home Financials are based on the most recent Mortgage that was taken out on this home.
Original Mortgage
$124,000
Interest Rate
6.69%
Mortgage Type
Purchase Money Mortgage
Create a Home Valuation Report for This Property
The Home Valuation Report is an in-depth analysis detailing your home's value as well as a comparison with similar homes in the area
Home Values in the Area
Average Home Value in this Area
Purchase History
| Date | Buyer | Sale Price | Title Company |
|---|---|---|---|
| Pyle Michael E | $155,000 | -- |
Source: Public Records
Mortgage History
| Date | Status | Borrower | Loan Amount |
|---|---|---|---|
| Open | Pyle Michael E | $10,000 | |
| Closed | Pyle Michael E | $124,000 |
Source: Public Records
Tax History Compared to Growth
Tax History
| Year | Tax Paid | Tax Assessment Tax Assessment Total Assessment is a certain percentage of the fair market value that is determined by local assessors to be the total taxable value of land and additions on the property. | Land | Improvement |
|---|---|---|---|---|
| 2025 | $8,163 | $698,900 | $472,200 | $226,700 |
| 2024 | $7,088 | $605,800 | $452,400 | $153,400 |
| 2023 | $7,871 | $579,600 | $430,800 | $148,800 |
| 2022 | $7,433 | $561,000 | $409,300 | $151,700 |
| 2021 | $6,696 | $546,600 | $394,900 | $151,700 |
| 2020 | $6,462 | $532,300 | $380,600 | $151,700 |
| 2019 | $6,077 | $471,800 | $366,200 | $105,600 |
| 2018 | $6,150 | $456,600 | $359,000 | $97,600 |
| 2017 | $5,644 | $406,300 | $308,700 | $97,600 |
| 2016 | $5,363 | $392,000 | $294,400 | $97,600 |
| 2015 | $5,567 | $370,400 | $272,800 | $97,600 |
| 2014 | $5,220 | $348,900 | $251,300 | $97,600 |
Source: Public Records
Map
Nearby Homes
- 63-65 Evans St
- 654 Main St
- 20 Whitman Rd Unit B-1
- 4 Repton Cir Unit 4410
- 3 Repton Cir Unit 3401
- 5 Chapman St
- 71 Gleason St
- 34 Aberdeen Ave
- 100 Whitman Rd
- 78 Barbara Rd Unit 1
- 1 Farwell Cir
- 135 Grove St Unit 135
- 32 Howard St Unit 32
- 35 Bacon St
- 164 Grove St
- 27-29 Edenfield Ave
- 32 Bacon St
- 113 Farnum Rd
- 109 A Lexington St
- 10 Naviens Ln Unit 2