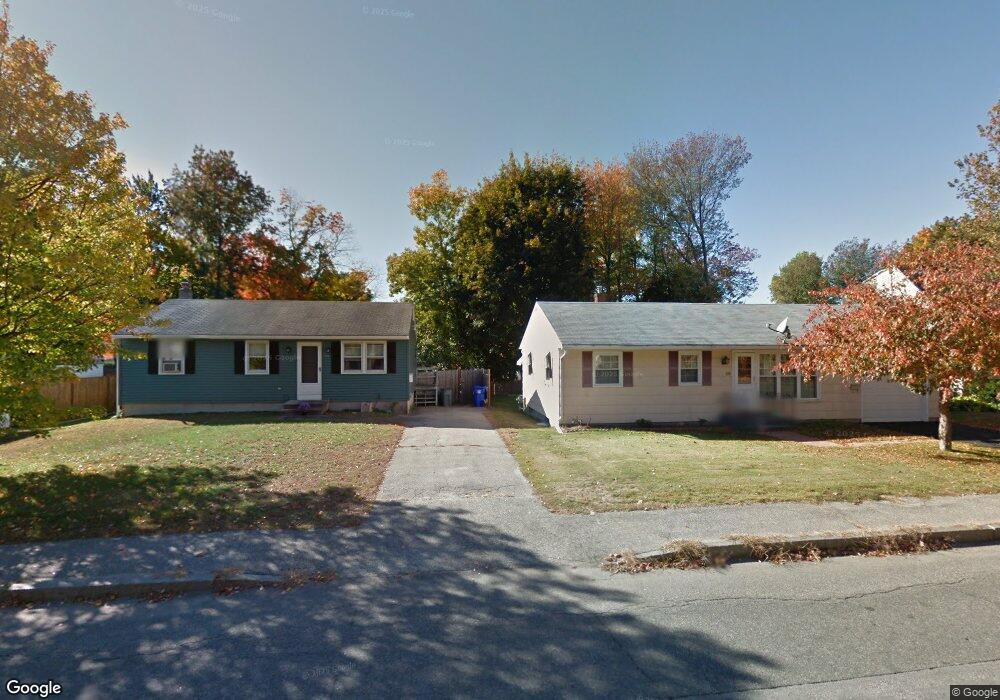
95 S Porter St Manchester, NH 03103
Southside NeighborhoodEstimated Value: $402,000 - $428,000
3
Beds
2
Baths
1,104
Sq Ft
$379/Sq Ft
Est. Value
About This Home
This home is located at 95 S Porter St, Manchester, NH 03103 and is currently estimated at $417,873, approximately $378 per square foot. 95 S Porter St is a home located in Hillsborough County with nearby schools including Jewett Street Elementary School, Southside Middle School, and Manchester Memorial High School.
Ownership History
Date
Name
Owned For
Owner Type
Purchase Details
Closed on
Sep 2, 2025
Sold by
Le Son H and Pham Dung K
Bought by
Pham Le Ft and Le
Current Estimated Value
Purchase Details
Closed on
Aug 15, 2005
Sold by
Mcgranaghan Catherine A
Bought by
Le Son Hong
Home Financials for this Owner
Home Financials are based on the most recent Mortgage that was taken out on this home.
Original Mortgage
$199,800
Interest Rate
5.54%
Mortgage Type
Purchase Money Mortgage
Purchase Details
Closed on
Mar 4, 1997
Sold by
Linehan Helen
Bought by
Mcgranaghan Richard P and Mcgranagha Catherine A
Home Financials for this Owner
Home Financials are based on the most recent Mortgage that was taken out on this home.
Original Mortgage
$39,000
Interest Rate
7.78%
Mortgage Type
Purchase Money Mortgage
Create a Home Valuation Report for This Property
The Home Valuation Report is an in-depth analysis detailing your home's value as well as a comparison with similar homes in the area
Home Values in the Area
Average Home Value in this Area
Purchase History
| Date | Buyer | Sale Price | Title Company |
|---|---|---|---|
| Pham Le Ft | -- | -- | |
| Le Son Hong | $206,000 | -- | |
| Le Son Hong | $206,000 | -- | |
| Mcgranaghan Richard P | $70,000 | -- | |
| Mcgranaghan Richard P | $70,000 | -- |
Source: Public Records
Mortgage History
| Date | Status | Borrower | Loan Amount |
|---|---|---|---|
| Previous Owner | Mcgranaghan Richard P | $161,600 | |
| Previous Owner | Mcgranaghan Richard P | $199,800 | |
| Previous Owner | Mcgranaghan Richard P | $39,000 |
Source: Public Records
Tax History Compared to Growth
Tax History
| Year | Tax Paid | Tax Assessment Tax Assessment Total Assessment is a certain percentage of the fair market value that is determined by local assessors to be the total taxable value of land and additions on the property. | Land | Improvement |
|---|---|---|---|---|
| 2024 | $5,234 | $267,300 | $98,600 | $168,700 |
| 2023 | $5,041 | $267,300 | $98,600 | $168,700 |
| 2022 | $4,876 | $267,300 | $98,600 | $168,700 |
| 2021 | $4,726 | $267,300 | $98,600 | $168,700 |
| 2020 | $4,301 | $174,400 | $68,000 | $106,400 |
| 2019 | $4,241 | $174,400 | $68,000 | $106,400 |
| 2018 | $4,130 | $174,400 | $68,000 | $106,400 |
| 2017 | $4,067 | $174,400 | $68,000 | $106,400 |
| 2016 | $4,036 | $174,400 | $68,000 | $106,400 |
| 2015 | $4,043 | $172,500 | $63,000 | $109,500 |
| 2014 | $4,054 | $172,500 | $63,000 | $109,500 |
| 2013 | $3,911 | $172,500 | $63,000 | $109,500 |
Source: Public Records
Map
Nearby Homes