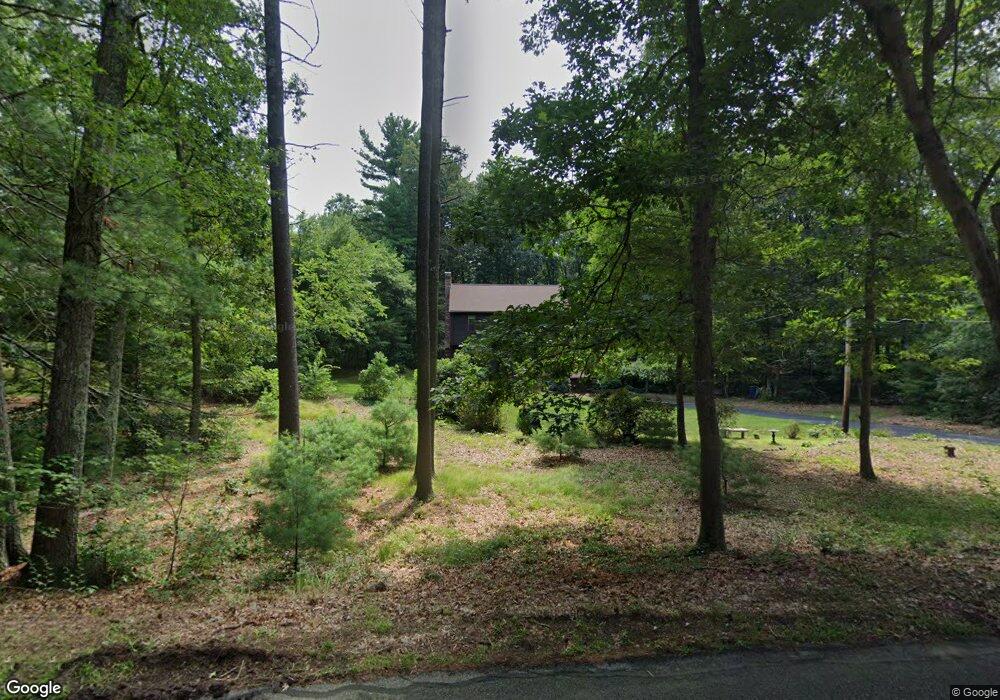
95 Spring St Wrentham, MA 02093
West Wrentham NeighborhoodEstimated Value: $615,000 - $667,000
4
Beds
2
Baths
1,728
Sq Ft
$374/Sq Ft
Est. Value
About This Home
This home is located at 95 Spring St, Wrentham, MA 02093 and is currently estimated at $645,975, approximately $373 per square foot. 95 Spring St is a home located in Norfolk County with nearby schools including Delaney Elementary School, Charles E Roderick, and Mercymount Country Day School.
Ownership History
Date
Name
Owned For
Owner Type
Purchase Details
Closed on
Oct 10, 2018
Sold by
Shipala Walter F and Shipala Mary J
Bought by
Lawes Ret
Current Estimated Value
Purchase Details
Closed on
Mar 25, 2004
Sold by
Shipala Mary J and Shipala Walter F
Bought by
Shipala Mary J and Shipala Walter F
Purchase Details
Closed on
Mar 24, 2004
Sold by
Shipala Mary J and Shipala Walter F
Bought by
Shipala Ret and Shipala Mary J
Purchase Details
Closed on
Aug 31, 1977
Bought by
Shipala Ret
Create a Home Valuation Report for This Property
The Home Valuation Report is an in-depth analysis detailing your home's value as well as a comparison with similar homes in the area
Home Values in the Area
Average Home Value in this Area
Purchase History
| Date | Buyer | Sale Price | Title Company |
|---|---|---|---|
| Lawes Ret | -- | -- | |
| Shipala Mary J | -- | -- | |
| Shipala Ret | -- | -- | |
| Shipala Ret | $53,100 | -- |
Source: Public Records
Tax History
| Year | Tax Paid | Tax Assessment Tax Assessment Total Assessment is a certain percentage of the fair market value that is determined by local assessors to be the total taxable value of land and additions on the property. | Land | Improvement |
|---|---|---|---|---|
| 2025 | $6,749 | $582,300 | $288,400 | $293,900 |
| 2024 | $6,550 | $545,800 | $288,400 | $257,400 |
| 2023 | $6,169 | $488,800 | $262,300 | $226,500 |
| 2022 | $6,104 | $446,500 | $255,400 | $191,100 |
| 2021 | $5,833 | $414,600 | $238,700 | $175,900 |
| 2020 | $5,265 | $369,500 | $182,100 | $187,400 |
| 2019 | $5,097 | $361,000 | $182,100 | $178,900 |
| 2018 | $5,252 | $368,800 | $181,800 | $187,000 |
| 2017 | $5,136 | $360,400 | $178,300 | $182,100 |
| 2016 | $5,055 | $354,000 | $173,200 | $180,800 |
| 2015 | $4,967 | $331,600 | $166,500 | $165,100 |
| 2014 | $4,885 | $319,100 | $160,100 | $159,000 |
Source: Public Records
Map
Nearby Homes
- 10 Follett Dr
- 60 Grant Ave
- 9 Reagan Ave
- 1620 West St
- 1565 West St
- 900 Washington St Lot 2
- 25 Nature View Dr
- 20 Nature View Dr
- 365 W Wrentham Rd
- 925 Washington St
- 180 Pine Swamp Rd
- 56 Pine Swamp Rd
- 9 Pebble Cir Unit 9
- 9 Brookfield Ln
- 65 Palmetto Dr Unit 65
- 21 Palmetto Dr Unit 21
- 24 Palmetto Dr Unit 24
- 47 Austin Dr
- 18 Bubbling Brook Rd
- 4 Carnation St
- 85 Spring St
- 105 Spring St
- 90 Spring St
- 90 Spring St Unit 90
- 80 Spring St
- 100 Spring St
- 70 Spring St
- 5 Miscoe Brook Dr
- 10 Miscoe Brook Dr
- 20 Miscoe Brook Dr
- 55 Spring St
- 15 Miscoe Brook Dr
- 30 Miscoe Brook Dr
- 135 Spring St
- 60 Spring St
- 2035 West St
- 45 Spring St
- 2045 West St
- 40 Miscoe Brook Dr
- 40 Spring St
Your Personal Tour Guide
Ask me questions while you tour the home.