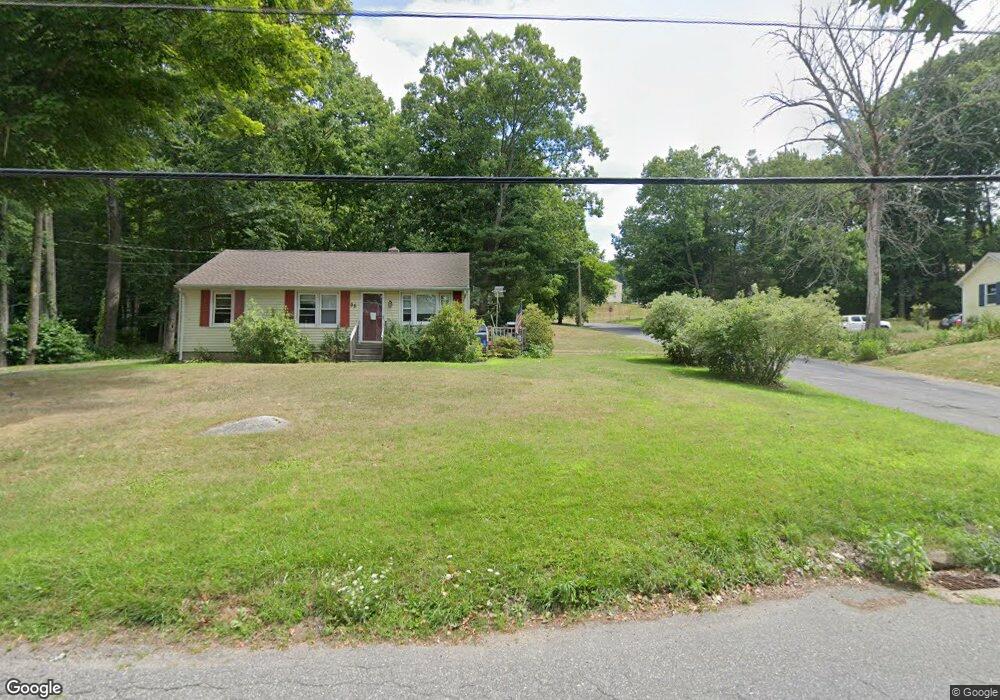
95 Stanton Ave Winsted, CT 06098
Estimated Value: $214,000 - $242,243
3
Beds
1
Bath
925
Sq Ft
$249/Sq Ft
Est. Value
About This Home
This home is located at 95 Stanton Ave, Winsted, CT 06098 and is currently estimated at $230,061, approximately $248 per square foot. 95 Stanton Ave is a home located in Litchfield County with nearby schools including Explorations Charter School, St Anthony School, and The Gilbert School.
Ownership History
Date
Name
Owned For
Owner Type
Purchase Details
Closed on
Aug 4, 2015
Sold by
Guerin Gary D and Guerin Kelly L
Bought by
Riiska Gary
Current Estimated Value
Purchase Details
Closed on
Mar 5, 2002
Sold by
Washington Daniel C
Bought by
Guerin Gary D and Guerin Kelly L
Home Financials for this Owner
Home Financials are based on the most recent Mortgage that was taken out on this home.
Original Mortgage
$92,820
Interest Rate
6.85%
Purchase Details
Closed on
Mar 31, 1997
Sold by
Willard Dianne A
Bought by
Washington Daniel C
Home Financials for this Owner
Home Financials are based on the most recent Mortgage that was taken out on this home.
Original Mortgage
$80,400
Interest Rate
7.59%
Mortgage Type
Unknown
Create a Home Valuation Report for This Property
The Home Valuation Report is an in-depth analysis detailing your home's value as well as a comparison with similar homes in the area
Home Values in the Area
Average Home Value in this Area
Purchase History
| Date | Buyer | Sale Price | Title Company |
|---|---|---|---|
| Riiska Gary | $65,000 | -- | |
| Riiska Gary | $65,000 | -- | |
| Guerin Gary D | $91,000 | -- | |
| Guerin Gary D | $91,000 | -- | |
| Washington Daniel C | $83,000 | -- | |
| Washington Daniel C | $83,000 | -- |
Source: Public Records
Mortgage History
| Date | Status | Borrower | Loan Amount |
|---|---|---|---|
| Previous Owner | Washington Daniel C | $111,700 | |
| Previous Owner | Washington Daniel C | $92,820 | |
| Previous Owner | Washington Daniel C | $80,400 |
Source: Public Records
Tax History Compared to Growth
Tax History
| Year | Tax Paid | Tax Assessment Tax Assessment Total Assessment is a certain percentage of the fair market value that is determined by local assessors to be the total taxable value of land and additions on the property. | Land | Improvement |
|---|---|---|---|---|
| 2025 | $3,373 | $115,640 | $32,830 | $82,810 |
| 2024 | $3,150 | $115,640 | $32,830 | $82,810 |
| 2023 | $3,052 | $115,640 | $32,830 | $82,810 |
| 2022 | $2,773 | $82,670 | $23,800 | $58,870 |
| 2021 | $2,773 | $82,670 | $23,800 | $58,870 |
| 2020 | $2,773 | $82,670 | $23,800 | $58,870 |
| 2019 | $2,773 | $82,670 | $23,800 | $58,870 |
| 2018 | $2,773 | $82,670 | $23,800 | $58,870 |
| 2017 | $2,747 | $81,900 | $23,800 | $58,100 |
| 2016 | $2,808 | $83,720 | $23,800 | $59,920 |
| 2015 | $2,738 | $83,720 | $23,800 | $59,920 |
| 2014 | -- | $83,720 | $23,800 | $59,920 |
Source: Public Records
Map
Nearby Homes
- 94 Stanton Ave
- 9 Berg St
- 92 Stanton Ave
- 89 Stanton Ave
- 98 Stanton Ave
- 88 Stanton Ave
- 87 Stanton Ave
- 126 Stanton Ave
- 84 Stanton Ave
- 123 Stanton Ave
- 83A Stanton Ave
- 137 Waldron St
- 128 Stanton Ave
- 180 Gilbert Ave
- 180 Gilbert Ave
- 131 Stanton Ave
- 0 Royer St
- 206 Gilbert Ave
- 204 Gilbert Ave
- 136 Waldron St Unit 138