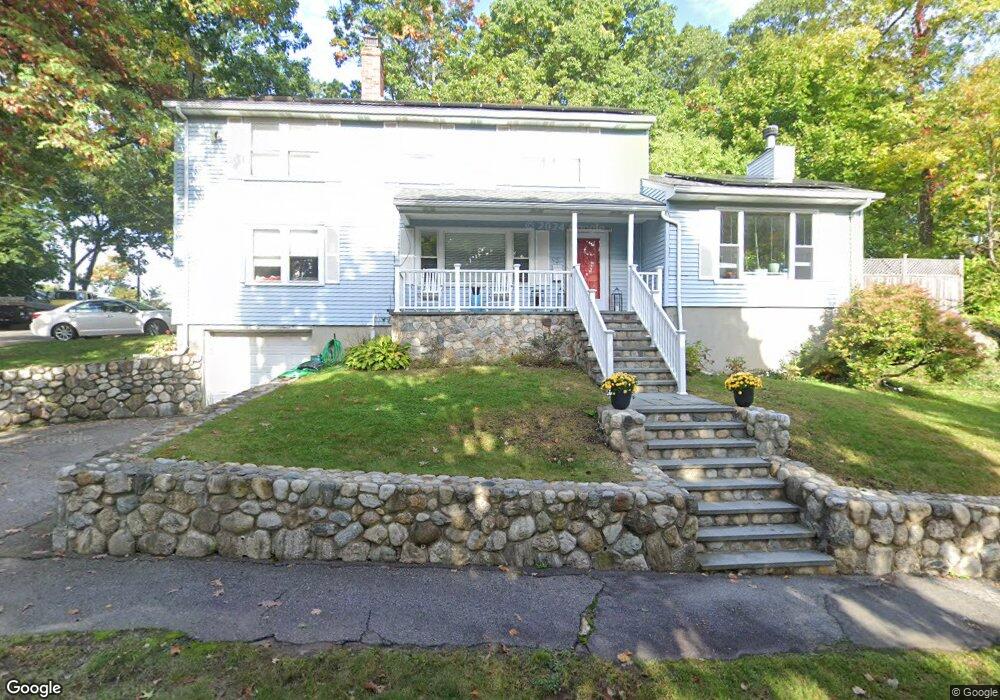
95 Wetherbee Rd Waltham, MA 02453
Cedarwood NeighborhoodEstimated Value: $895,937 - $1,056,000
5
Beds
4
Baths
2,208
Sq Ft
$438/Sq Ft
Est. Value
About This Home
This home is located at 95 Wetherbee Rd, Waltham, MA 02453 and is currently estimated at $967,984, approximately $438 per square foot. 95 Wetherbee Rd is a home located in Middlesex County with nearby schools including William F. Stanley Elementary School, John W. Mcdevitt Middle School, and Waltham Sr High School.
Ownership History
Date
Name
Owned For
Owner Type
Purchase Details
Closed on
Jun 30, 2003
Sold by
Cecilia S and Liu Charles C
Bought by
Hart Kathryn A
Current Estimated Value
Home Financials for this Owner
Home Financials are based on the most recent Mortgage that was taken out on this home.
Original Mortgage
$371,200
Interest Rate
5.53%
Mortgage Type
Purchase Money Mortgage
Purchase Details
Closed on
Aug 4, 2000
Sold by
Wang Xiao Jing and Lin Qian
Bought by
Liu Charles C
Home Financials for this Owner
Home Financials are based on the most recent Mortgage that was taken out on this home.
Original Mortgage
$252,700
Interest Rate
8.1%
Mortgage Type
Purchase Money Mortgage
Purchase Details
Closed on
Sep 12, 1995
Sold by
Girouard Paul J and Girouard Aurela R
Bought by
Wang Xiao Jing
Create a Home Valuation Report for This Property
The Home Valuation Report is an in-depth analysis detailing your home's value as well as a comparison with similar homes in the area
Home Values in the Area
Average Home Value in this Area
Purchase History
| Date | Buyer | Sale Price | Title Company |
|---|---|---|---|
| Hart Kathryn A | $464,000 | -- | |
| Liu Charles C | $343,000 | -- | |
| Wang Xiao Jing | $224,500 | -- |
Source: Public Records
Mortgage History
| Date | Status | Borrower | Loan Amount |
|---|---|---|---|
| Open | Wang Xiao Jing | $334,000 | |
| Closed | Hart Kathryn A | $371,200 | |
| Previous Owner | Wang Xiao Jing | $274,400 | |
| Previous Owner | Wang Xiao Jing | $252,700 |
Source: Public Records
Tax History
| Year | Tax Paid | Tax Assessment Tax Assessment Total Assessment is a certain percentage of the fair market value that is determined by local assessors to be the total taxable value of land and additions on the property. | Land | Improvement |
|---|---|---|---|---|
| 2025 | $7,636 | $777,600 | $417,300 | $360,300 |
| 2024 | $7,377 | $765,200 | $409,600 | $355,600 |
| 2023 | $7,265 | $704,000 | $370,900 | $333,100 |
| 2022 | $7,321 | $657,200 | $340,000 | $317,200 |
| 2021 | $7,269 | $642,100 | $340,000 | $302,100 |
| 2020 | $7,270 | $608,400 | $316,800 | $291,600 |
| 2019 | $6,841 | $540,400 | $298,700 | $241,700 |
| 2018 | $6,221 | $493,300 | $276,600 | $216,700 |
| 2017 | $5,886 | $468,600 | $251,900 | $216,700 |
| 2016 | $5,679 | $464,000 | $247,300 | $216,700 |
| 2015 | $5,519 | $420,300 | $216,400 | $203,900 |
Source: Public Records
Map
Nearby Homes
- 15 Flagg Cir
- 8 Keach Terrace
- 19 Everett St Unit 2
- 7 Pearl St
- 130 Summer St
- 105 Summer St
- 41 Auburn St
- 22 Irene Cir
- 55 Forest Ridge Rd
- 707 South St
- 713 South St
- 76 Robin Rd
- 54-56 South St
- 31 Weston St Unit 2
- 12 Robin Rd
- 11 Hillcrest Rd
- 4 Willow Rd
- 32 Vernon St
- 39 Floyd St Unit 2
- 43-45 Wellington St Unit 3
- 258 Florence Rd
- 85 Wetherbee Rd
- 270 Florence Rd
- 254 Florence Rd
- 81 Wetherbee Rd
- 84 Wetherbee Rd
- 271 Florence Rd
- 276 Florence Rd
- 250 Florence Rd
- 77 Wetherbee Rd
- 80 Wetherbee Rd
- 118 Thornton Rd
- 114 Thornton Rd
- 110 Thornton Rd
- 249 Florence Rd
- 124 Thornton Rd
- 277 Florence Rd
- 130 Thornton Rd
- 75 Harland Rd
- 67 Harland Rd
Your Personal Tour Guide
Ask me questions while you tour the home.