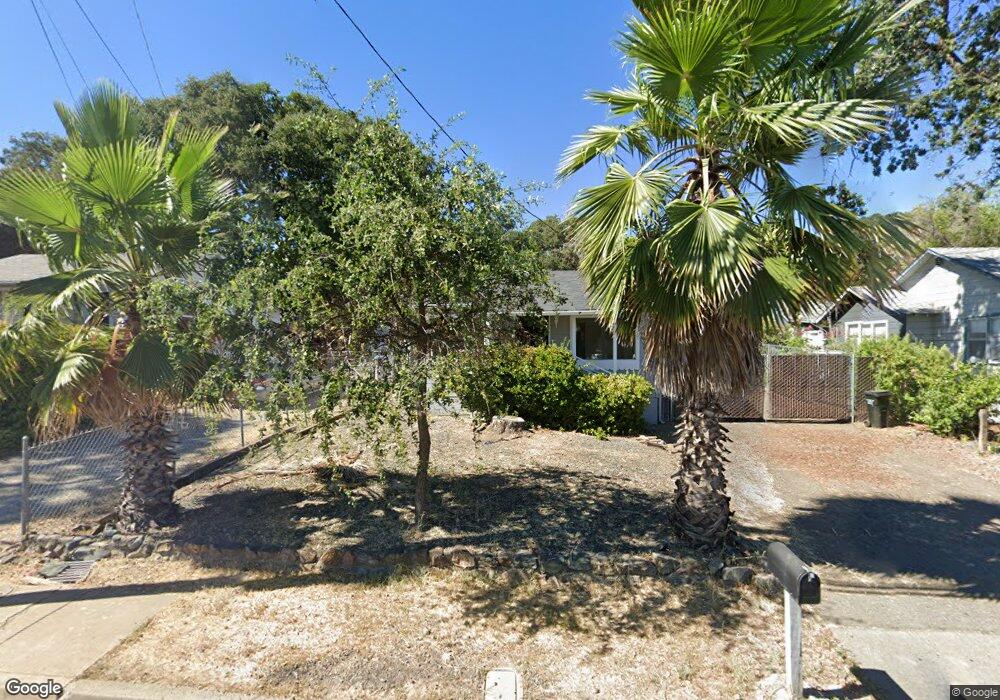
950 11th St Lakeport, CA 95453
Estimated Value: $167,000 - $292,000
2
Beds
1
Bath
746
Sq Ft
$298/Sq Ft
Est. Value
About This Home
This home is located at 950 11th St, Lakeport, CA 95453 and is currently estimated at $222,039, approximately $297 per square foot. 950 11th St is a home located in Lake County with nearby schools including Lakeport Elementary School, Terrace Middle School, and Clear Lake High School.
Ownership History
Date
Name
Owned For
Owner Type
Purchase Details
Closed on
Jun 18, 2024
Sold by
Federal National Mortgage Association and Fannie Mae
Bought by
Diana Masuen Living Trust and Masuen
Current Estimated Value
Purchase Details
Closed on
Aug 1, 2023
Sold by
Reverse Mortgage Solutions Inc
Bought by
Federal National Mortgage Association
Purchase Details
Closed on
Jul 21, 2023
Sold by
1St American Title Insurance C
Bought by
Reverse Mortgage Solutions Inc and Mortgage Assets Mgmt Llc
Purchase Details
Closed on
Aug 25, 2005
Sold by
Annab Nasser and Annab Manal
Bought by
Hill Nikeeta Ann
Create a Home Valuation Report for This Property
The Home Valuation Report is an in-depth analysis detailing your home's value as well as a comparison with similar homes in the area
Home Values in the Area
Average Home Value in this Area
Purchase History
| Date | Buyer | Sale Price | Title Company |
|---|---|---|---|
| Diana Masuen Living Trust | $163,500 | Servicelink | |
| Federal National Mortgage Association | -- | First American Mortgage Soluti | |
| Reverse Mortgage Solutions Inc | $237,192 | First American Title Insurance | |
| Hill Nikeeta Ann | $178,000 | First American Title |
Source: Public Records
Tax History Compared to Growth
Tax History
| Year | Tax Paid | Tax Assessment Tax Assessment Total Assessment is a certain percentage of the fair market value that is determined by local assessors to be the total taxable value of land and additions on the property. | Land | Improvement |
|---|---|---|---|---|
| 2024 | $2,943 | $238,467 | $100,475 | $137,992 |
| 2023 | $3,650 | $233,792 | $98,505 | $135,287 |
| 2022 | $2,765 | $229,209 | $96,574 | $132,635 |
| 2021 | $2,742 | $224,716 | $94,681 | $130,035 |
| 2020 | $2,657 | $222,413 | $93,711 | $128,702 |
| 2019 | $2,722 | $142,400 | $60,000 | $82,400 |
| 2018 | $1,743 | $142,400 | $60,000 | $82,400 |
| 2017 | $1,748 | $142,400 | $60,000 | $82,400 |
| 2016 | $1,734 | $142,400 | $60,000 | $82,400 |
| 2015 | -- | $142,400 | $60,000 | $82,400 |
| 2014 | $1,646 | $142,400 | $60,000 | $82,400 |
Source: Public Records
Map
Nearby Homes