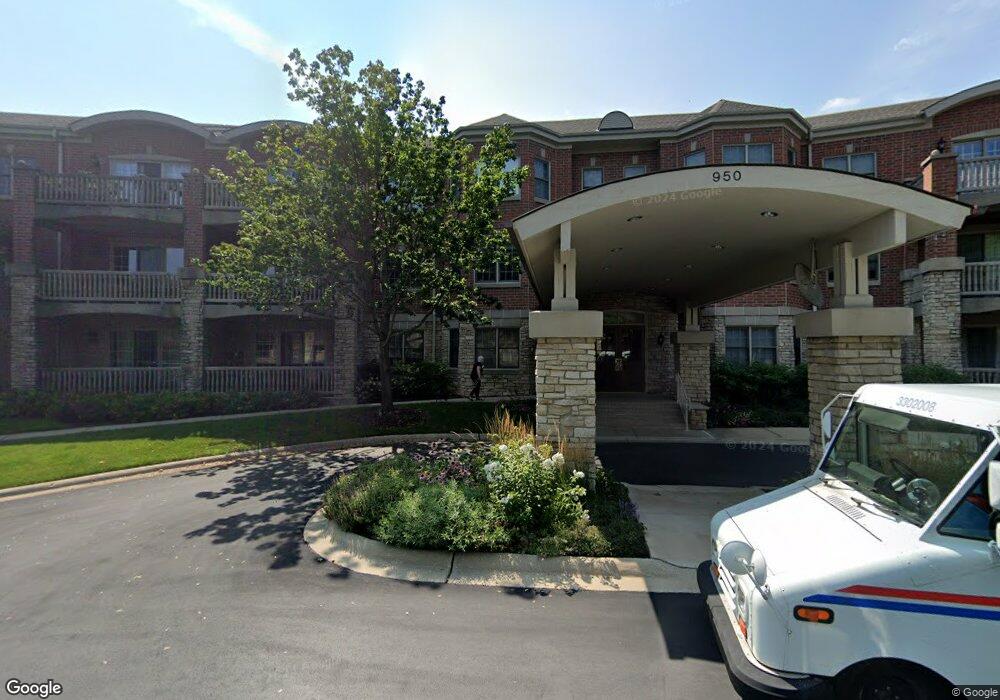
950 Augusta Way Unit W12C Highland Park, IL 60035
West Highland Park NeighborhoodEstimated Value: $582,000 - $608,000
2
Beds
2
Baths
1,926
Sq Ft
$309/Sq Ft
Est. Value
About This Home
This home is located at 950 Augusta Way Unit W12C, Highland Park, IL 60035 and is currently estimated at $595,456, approximately $309 per square foot. 950 Augusta Way Unit W12C is a home located in Lake County with nearby schools including Wayne Thomas Elementary School, Northwood Jr High School, and Highland Park High School.
Ownership History
Date
Name
Owned For
Owner Type
Purchase Details
Closed on
Dec 30, 2022
Sold by
Jaffe Ruth Mary
Bought by
Ruth M Jaffe Declaration Of Trust and Jaffe
Current Estimated Value
Purchase Details
Closed on
Sep 15, 2022
Sold by
Tucker Marsha
Bought by
Jaffe Ruth Mary
Purchase Details
Closed on
Apr 20, 2016
Sold by
Rubin Barry and Samson Ellen
Bought by
Tucker Kenneth and Tucker Marsha
Home Financials for this Owner
Home Financials are based on the most recent Mortgage that was taken out on this home.
Original Mortgage
$250,000
Interest Rate
3.25%
Mortgage Type
New Conventional
Purchase Details
Closed on
Dec 30, 2005
Sold by
Rubin Dolores F and Dolores F Rubin Trust
Bought by
Rubin Milton and Rubin Dolores F
Purchase Details
Closed on
Jun 5, 2001
Sold by
Ferris At Highland Park Lp
Bought by
Rubin Dolores F and The Dolores F Rubin Trust
Create a Home Valuation Report for This Property
The Home Valuation Report is an in-depth analysis detailing your home's value as well as a comparison with similar homes in the area
Home Values in the Area
Average Home Value in this Area
Purchase History
| Date | Buyer | Sale Price | Title Company |
|---|---|---|---|
| Ruth M Jaffe Declaration Of Trust | -- | None Listed On Document | |
| Jaffe Ruth Mary | $510,000 | None Listed On Document | |
| Tucker Kenneth | $430,000 | Affinity Title Services Llc | |
| Rubin Milton | -- | None Available | |
| Rubin Dolores F | $427,000 | -- |
Source: Public Records
Mortgage History
| Date | Status | Borrower | Loan Amount |
|---|---|---|---|
| Previous Owner | Tucker Kenneth | $250,000 |
Source: Public Records
Tax History Compared to Growth
Tax History
| Year | Tax Paid | Tax Assessment Tax Assessment Total Assessment is a certain percentage of the fair market value that is determined by local assessors to be the total taxable value of land and additions on the property. | Land | Improvement |
|---|---|---|---|---|
| 2024 | $11,730 | $157,083 | $13,831 | $143,252 |
| 2023 | $10,421 | $141,593 | $12,467 | $129,126 |
| 2022 | $10,421 | $126,599 | $14,200 | $112,399 |
| 2021 | $9,584 | $122,377 | $13,726 | $108,651 |
| 2020 | $9,274 | $122,377 | $13,726 | $108,651 |
| 2019 | $8,968 | $121,805 | $13,662 | $108,143 |
| 2018 | $9,918 | $136,187 | $14,959 | $121,228 |
| 2017 | $9,762 | $135,402 | $14,873 | $120,529 |
| 2016 | $9,448 | $134,508 | $14,159 | $120,349 |
| 2015 | $9,112 | $124,972 | $13,155 | $111,817 |
| 2014 | $7,830 | $106,569 | $13,321 | $93,248 |
| 2012 | $7,716 | $107,191 | $13,399 | $93,792 |
Source: Public Records
Map
Nearby Homes
- 950 Augusta Way Unit 204
- 940 Augusta Way Unit 304
- 940 Augusta Way Unit 309
- 2471 Augusta Way
- 2524 Augusta Way
- 927 Half Day Rd
- 1064 Livingston (Lot 3) Ave
- The Classic Plan at Hidden Oak of Highland Park
- The Astoria Plan at Hidden Oak of Highland Park
- The Essex Plan at Hidden Oak of Highland Park
- 1066 Livingston St
- 1060 Livingston (Lot 5) Ave
- 1062 Livingston St
- 0 Wrendale Ave Unit MRD12487576
- 1 Burtis Ave
- 1220 Park Ave W Unit 115
- 2542 Green Bay Rd
- 1250 Park Ave W Unit 435
- 228 Llewellyn Ave
- 0 Skokie Ave
- 950 Augusta Way Unit 203
- 950 Augusta Way Unit 215
- 950 Augusta Way Unit 210
- 950 Augusta Way Unit 214
- 950 Augusta Way Unit 207
- 950 Augusta Way Unit 307
- 950 Augusta Way Unit 102
- 950 Augusta Way Unit 107
- 950 Augusta Way Unit W15C
- 950 Augusta Way Unit W14C
- 950 Augusta Way Unit W13C
- 950 Augusta Way Unit W11C
- 950 Augusta Way Unit W10C
- 950 Augusta Way Unit W9C
- 950 Augusta Way Unit W7C
- 950 Augusta Way Unit W6C
- 950 Augusta Way Unit W5C
- 950 Augusta Way Unit W4C
- 950 Augusta Way Unit W3C
- 950 Augusta Way Unit W2C