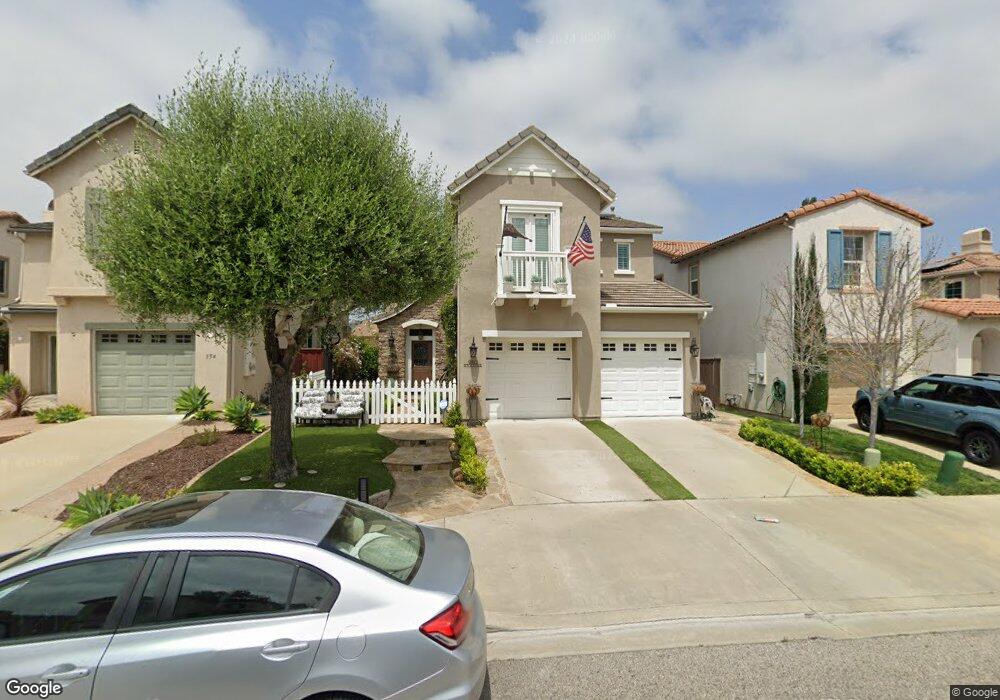
950 Avalon Way Unit 15 San Marcos, CA 92078
San Elijo NeighborhoodEstimated Value: $1,286,382 - $1,440,000
3
Beds
3
Baths
2,260
Sq Ft
$604/Sq Ft
Est. Value
About This Home
This home is located at 950 Avalon Way Unit 15, San Marcos, CA 92078 and is currently estimated at $1,364,096, approximately $603 per square foot. 950 Avalon Way Unit 15 is a home located in San Diego County with nearby schools including San Elijo Elementary School, San Elijo Middle School, and San Marcos High School.
Ownership History
Date
Name
Owned For
Owner Type
Purchase Details
Closed on
Apr 20, 2020
Sold by
Gidner Damon Marc and Gidner Janet L
Bought by
Gidner Damon and Gidner Janet L
Current Estimated Value
Purchase Details
Closed on
Jul 29, 2019
Sold by
Gidner Damon M
Bought by
Gidner Damon M and Gidner Janet
Home Financials for this Owner
Home Financials are based on the most recent Mortgage that was taken out on this home.
Original Mortgage
$290,000
Outstanding Balance
$238,787
Interest Rate
3.7%
Mortgage Type
New Conventional
Estimated Equity
$1,125,309
Purchase Details
Closed on
Aug 12, 2004
Sold by
Gidner Janet L
Bought by
Gidner Damon M
Purchase Details
Closed on
Mar 9, 2004
Sold by
Richmond Amer Homes Of California Inc
Bought by
Gidner Damon M
Home Financials for this Owner
Home Financials are based on the most recent Mortgage that was taken out on this home.
Original Mortgage
$355,000
Interest Rate
6.37%
Mortgage Type
Purchase Money Mortgage
Create a Home Valuation Report for This Property
The Home Valuation Report is an in-depth analysis detailing your home's value as well as a comparison with similar homes in the area
Home Values in the Area
Average Home Value in this Area
Purchase History
| Date | Buyer | Sale Price | Title Company |
|---|---|---|---|
| Gidner Damon | -- | None Available | |
| Gidner Damon M | -- | California Members Title Co | |
| Gidner Damon M | -- | Chicago Title Co | |
| Gidner Damon M | $504,500 | Chicago Title Co |
Source: Public Records
Mortgage History
| Date | Status | Borrower | Loan Amount |
|---|---|---|---|
| Open | Gidner Damon M | $290,000 | |
| Previous Owner | Gidner Damon M | $355,000 |
Source: Public Records
Tax History Compared to Growth
Tax History
| Year | Tax Paid | Tax Assessment Tax Assessment Total Assessment is a certain percentage of the fair market value that is determined by local assessors to be the total taxable value of land and additions on the property. | Land | Improvement |
|---|---|---|---|---|
| 2025 | $10,076 | $719,514 | $320,588 | $398,926 |
| 2024 | $10,076 | $705,406 | $314,302 | $391,104 |
| 2023 | $10,076 | $691,576 | $308,140 | $383,436 |
| 2022 | $9,926 | $678,017 | $302,099 | $375,918 |
| 2021 | $9,784 | $664,724 | $296,176 | $368,548 |
| 2020 | $9,656 | $657,909 | $293,140 | $364,769 |
| 2019 | $9,683 | $645,010 | $287,393 | $357,617 |
| 2018 | $9,498 | $632,363 | $281,758 | $350,605 |
| 2017 | $131 | $619,965 | $276,234 | $343,731 |
| 2016 | $9,468 | $607,810 | $270,818 | $336,992 |
| 2015 | $9,331 | $598,682 | $266,751 | $331,931 |
| 2014 | $8,788 | $550,000 | $222,000 | $328,000 |
Source: Public Records
Map
Nearby Homes
- 880 Summer Moon Rd Unit 22
- 1726 Blue Water Ln
- 923 Citrine Way
- 1813 Windriver St
- 1797 Lemon Tree Ct
- 1781 Lemon Tree Ct Unit 3
- 0 Questhaven Rd Unit NDP2501375
- 1169 Westin Way
- 1162 Westin Way
- 630 Atherton St
- 1110 Festival Rd
- 0 Golden Eagle Trail Unit NDP2503140
- 1080 Vega Way
- 1278 Highbluff Ave
- 1241 Highbluff Ave
- 1367 Sky Ridge Ct
- 1282 Highbluff Ave
- 1440 Clearview Way Unit 25
- 1371 Sky Ridge Ct Unit 200
- 1208 Lexi Ct
- 948 Avalon Way
- 954 Avalon Way
- 946 Avalon Way Unit 15
- 956 Avalon Way
- 1707 Thorley Way
- 1709 Thorley Way
- 1705 Thorley Way
- 1713 Thorley Way
- 944 Avalon Way Unit 15
- 958 Avalon Way
- 1715 Thorley Way Unit 13
- 1703 Thorley Way
- 955 Avalon Way
- 949 Avalon Way
- 1717 Thorley Way Unit 13
- 960 Avalon Way
- 940 Avalon Way
- 957 Avalon Way
- 947 Avalon Way
- 945 Avalon Way