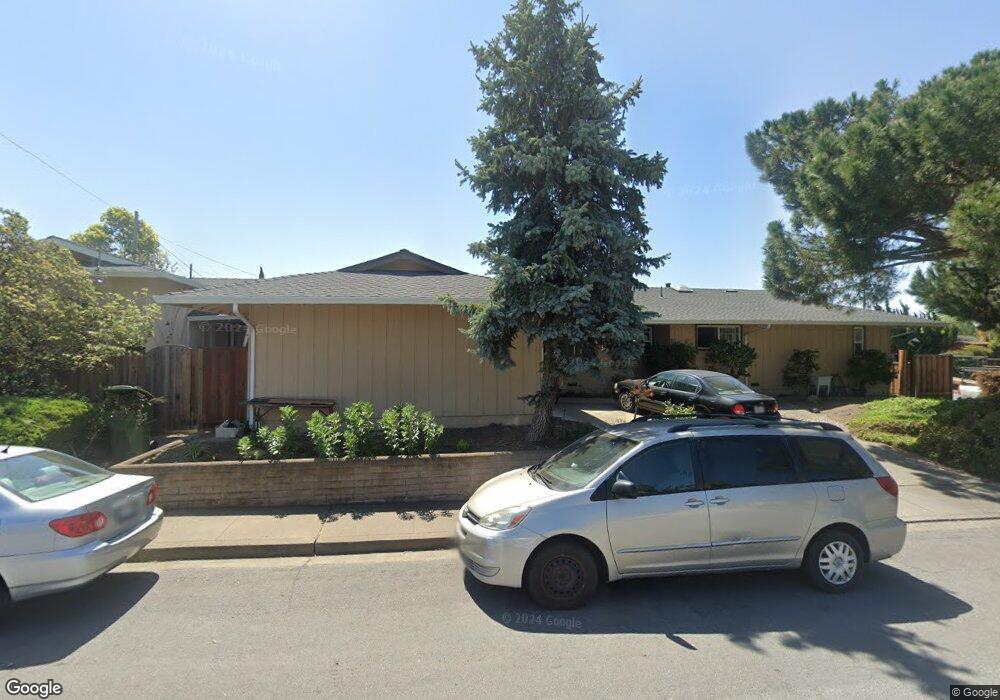
950 Camero Way Fremont, CA 94539
Kimber-Gomes NeighborhoodEstimated Value: $2,615,000 - $2,732,000
4
Beds
3
Baths
1,902
Sq Ft
$1,411/Sq Ft
Est. Value
About This Home
This home is located at 950 Camero Way, Fremont, CA 94539 and is currently estimated at $2,682,795, approximately $1,410 per square foot. 950 Camero Way is a home located in Alameda County with nearby schools including John Gomes Elementary School, William Hopkins Junior High School, and Mission San Jose High School.
Ownership History
Date
Name
Owned For
Owner Type
Purchase Details
Closed on
Jun 24, 2016
Sold by
Cheng Jin
Bought by
Cheng Jin
Current Estimated Value
Home Financials for this Owner
Home Financials are based on the most recent Mortgage that was taken out on this home.
Original Mortgage
$344,000
Outstanding Balance
$154,370
Interest Rate
3.64%
Mortgage Type
New Conventional
Estimated Equity
$2,528,425
Purchase Details
Closed on
Mar 7, 2007
Sold by
Gong Xiao Yan and Xia Yin
Bought by
Cheng Jin and Gong Jing
Home Financials for this Owner
Home Financials are based on the most recent Mortgage that was taken out on this home.
Original Mortgage
$838,400
Outstanding Balance
$496,553
Interest Rate
5.87%
Mortgage Type
Purchase Money Mortgage
Estimated Equity
$2,186,242
Purchase Details
Closed on
Dec 20, 2000
Sold by
Kikawa Tomokatsu and Kikawa Yuko
Bought by
Gong Xiao Yan and Xia Yin
Purchase Details
Closed on
Aug 20, 1998
Sold by
Duffie John and Duffie Lela J
Bought by
Kikawa Tomokatsu and Kikawa Yuko
Create a Home Valuation Report for This Property
The Home Valuation Report is an in-depth analysis detailing your home's value as well as a comparison with similar homes in the area
Home Values in the Area
Average Home Value in this Area
Purchase History
| Date | Buyer | Sale Price | Title Company |
|---|---|---|---|
| Cheng Jin | -- | First American Title Company | |
| Cheng Jin | $1,048,000 | Chicago Title Co | |
| Gong Xiao Yan | -- | New Century Title Company | |
| Kikawa Tomokatsu | $465,000 | Old Republic Title Company |
Source: Public Records
Mortgage History
| Date | Status | Borrower | Loan Amount |
|---|---|---|---|
| Open | Cheng Jin | $344,000 | |
| Open | Cheng Jin | $838,400 |
Source: Public Records
Tax History Compared to Growth
Tax History
| Year | Tax Paid | Tax Assessment Tax Assessment Total Assessment is a certain percentage of the fair market value that is determined by local assessors to be the total taxable value of land and additions on the property. | Land | Improvement |
|---|---|---|---|---|
| 2025 | $17,267 | $1,480,544 | $421,195 | $1,066,349 |
| 2024 | $17,267 | $1,451,386 | $412,939 | $1,045,447 |
| 2023 | $16,821 | $1,429,793 | $404,843 | $1,024,950 |
| 2022 | $16,628 | $1,394,767 | $396,907 | $1,004,860 |
| 2021 | $16,213 | $1,367,285 | $389,126 | $985,159 |
| 2020 | $16,338 | $1,360,195 | $385,136 | $975,059 |
| 2019 | $16,147 | $1,333,535 | $377,588 | $955,947 |
| 2018 | $15,835 | $1,307,396 | $370,187 | $937,209 |
| 2017 | $14,775 | $1,224,768 | $362,930 | $861,838 |
| 2016 | $14,363 | $1,186,052 | $355,815 | $830,237 |
| 2015 | $14,183 | $1,168,247 | $350,474 | $817,773 |
| 2014 | $13,825 | $1,135,000 | $340,500 | $794,500 |
Source: Public Records
Map
Nearby Homes
- 1137 Farragut Dr
- 1123 Farragut Dr
- 1401 Lemos Ln
- 260 Jacaranda Dr
- 1962 Briscoe Terrace
- 41043 Joyce Ave
- 41411 Apricot Ln
- 41519 Apricot Ln
- 41246 Mission Blvd
- 40827 Tomales Terrace
- 41252 Mission Blvd
- 2813 Pinnacles Terrace
- 40379 Dolerita Ave
- 2851 Finca Terrace
- 41392 Beatrice St
- 41620 Beatrice St
- 42077 Miranda St
- 40425 Chapel Way Unit 214
- 40425 Chapel Way Unit 309
- 41538 Casabella Common
- 40922 Camero Place
- 40925 Chiltern Dr
- 1000 Camero Way
- 951 Camero Way
- 40923 Camero Place
- 901 Camero Way
- 40951 Chiltern Dr
- 40930 Camero Place
- 993 Camero Way
- 40931 Camero Place
- 40924 Canto Place
- 40975 Chiltern Dr
- 40904 Canto Place
- 40924 Chiltern Dr
- 40934 Camero Place
- 40928 Canto Place
- 993 Bermuda Ct
- 1035 Camero Way
- 40900 Chiltern Dr
- 40935 Camero Place