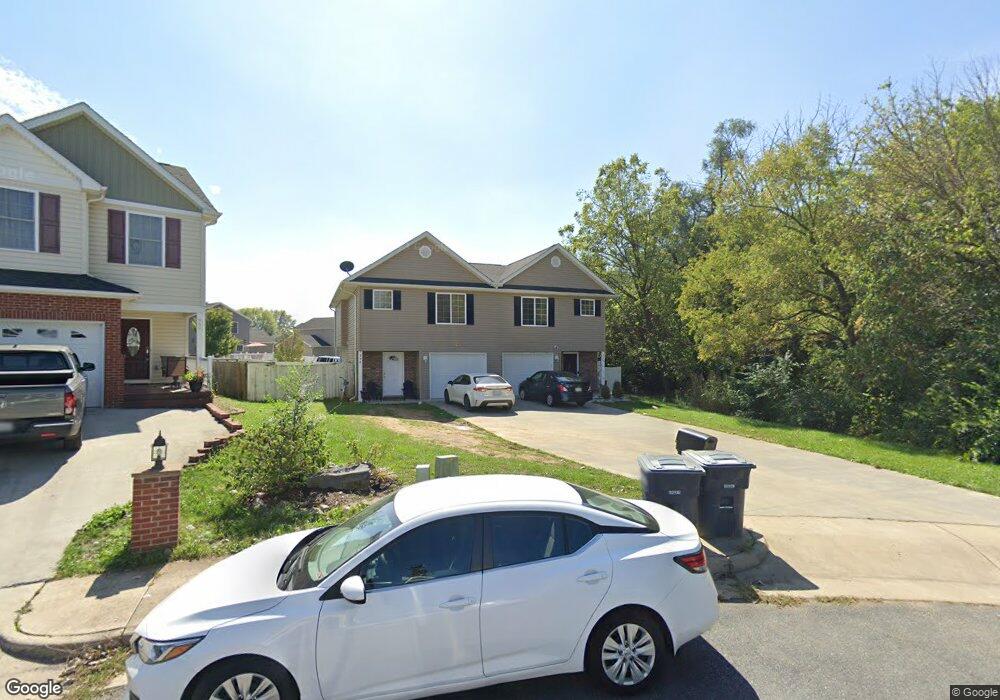
950 Roberts Ct Harrisonburg, VA 22802
Estimated Value: $280,000 - $328,000
3
Beds
3
Baths
1,416
Sq Ft
$214/Sq Ft
Est. Value
About This Home
This home is located at 950 Roberts Ct, Harrisonburg, VA 22802 and is currently estimated at $302,791, approximately $213 per square foot. 950 Roberts Ct is a home located in Harrisonburg City with nearby schools including Waterman Elementary School, Thomas Harrison Middle School, and Harrisonburg High School.
Ownership History
Date
Name
Owned For
Owner Type
Purchase Details
Closed on
Jul 10, 2019
Sold by
Brizendine Amanda and Griffin Lindsay
Bought by
Oliva Lazaro R Fernandez and Ruiz Isis
Current Estimated Value
Home Financials for this Owner
Home Financials are based on the most recent Mortgage that was taken out on this home.
Original Mortgage
$185,576
Outstanding Balance
$162,346
Interest Rate
3.75%
Mortgage Type
FHA
Estimated Equity
$140,445
Purchase Details
Closed on
Jul 27, 2016
Sold by
Velocity Construction Llc
Bought by
Brizendine Amanda and Griffin Lindsey
Home Financials for this Owner
Home Financials are based on the most recent Mortgage that was taken out on this home.
Original Mortgage
$152,000
Interest Rate
3.56%
Mortgage Type
New Conventional
Purchase Details
Closed on
Jul 17, 2013
Sold by
Ferguson Investments Llc
Bought by
Velocity Construction Llc
Create a Home Valuation Report for This Property
The Home Valuation Report is an in-depth analysis detailing your home's value as well as a comparison with similar homes in the area
Home Values in the Area
Average Home Value in this Area
Purchase History
| Date | Buyer | Sale Price | Title Company |
|---|---|---|---|
| Oliva Lazaro R Fernandez | $189,000 | None Available | |
| Brizendine Amanda | $160,000 | West View Title Agency Inc | |
| Velocity Construction Llc | $185,220 | None Available |
Source: Public Records
Mortgage History
| Date | Status | Borrower | Loan Amount |
|---|---|---|---|
| Open | Oliva Lazaro R Fernandez | $185,576 | |
| Previous Owner | Brizendine Amanda | $152,000 |
Source: Public Records
Tax History Compared to Growth
Tax History
| Year | Tax Paid | Tax Assessment Tax Assessment Total Assessment is a certain percentage of the fair market value that is determined by local assessors to be the total taxable value of land and additions on the property. | Land | Improvement |
|---|---|---|---|---|
| 2024 | $2,478 | $245,300 | $41,800 | $203,500 |
| 2023 | $0 | $193,700 | $33,000 | $160,700 |
| 2022 | $0 | $174,600 | $30,000 | $144,600 |
| 2021 | $1,505 | $167,200 | $30,000 | $137,200 |
| 2020 | $1,360 | $157,400 | $30,000 | $127,400 |
| 2019 | $1,360 | $157,400 | $30,000 | $127,400 |
| 2018 | $226 | $155,600 | $30,000 | $125,600 |
| 2017 | $226 | $155,200 | $30,000 | $125,200 |
| 2016 | $226 | $85,200 | $25,500 | $59,700 |
| 2015 | $226 | $31,400 | $31,400 | $0 |
| 2014 | -- | $33,300 | $33,300 | $0 |
Source: Public Records
Map
Nearby Homes