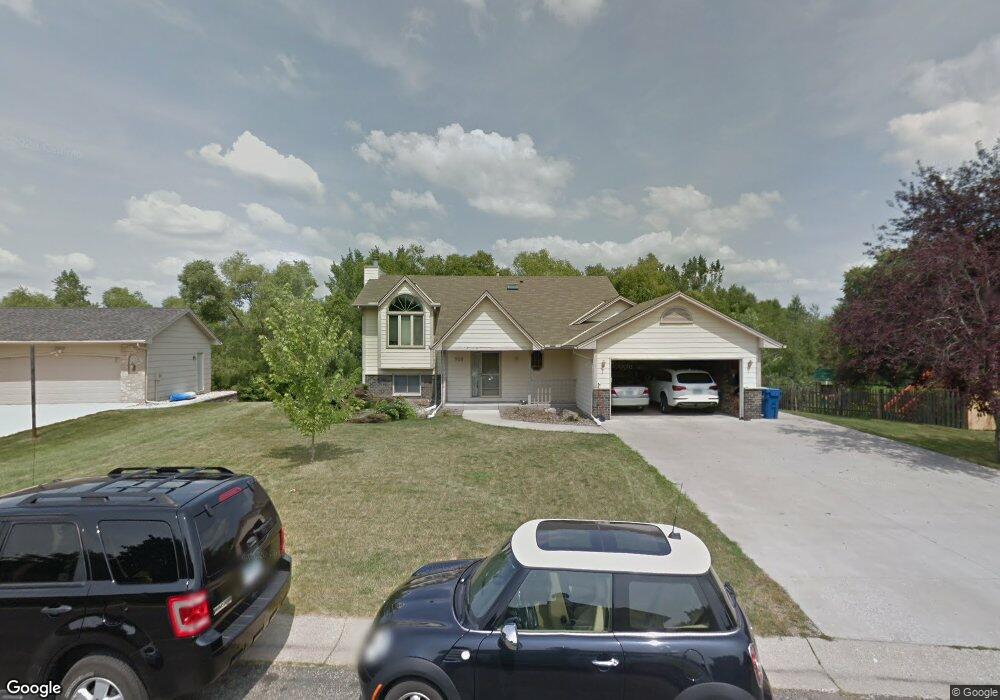
950 Saddlebrook Trail Chanhassen, MN 55317
Estimated Value: $438,000 - $518,000
4
Beds
2
Baths
1,257
Sq Ft
$376/Sq Ft
Est. Value
About This Home
This home is located at 950 Saddlebrook Trail, Chanhassen, MN 55317 and is currently estimated at $472,313, approximately $375 per square foot. 950 Saddlebrook Trail is a home located in Carver County with nearby schools including Chanhassen Elementary School, Pioneer Ridge Middle School, and Chanhassen High School.
Ownership History
Date
Name
Owned For
Owner Type
Purchase Details
Closed on
Dec 22, 2021
Sold by
Hpa Us1 Llc
Bought by
Sfr Ii Borrower 2021-3 Llc
Current Estimated Value
Purchase Details
Closed on
May 18, 2021
Sold by
Braget Travis T and Braget Meredith C
Bought by
Hpa Us1 Llc
Purchase Details
Closed on
Jun 30, 2015
Sold by
Vanchau Di
Bought by
Braget Travis T and Braget Meredith C
Home Financials for this Owner
Home Financials are based on the most recent Mortgage that was taken out on this home.
Original Mortgage
$216,000
Interest Rate
3.86%
Mortgage Type
New Conventional
Purchase Details
Closed on
Sep 27, 2002
Sold by
Frank John M and Frank Leslie T
Bought by
Pam Vim Llc
Purchase Details
Closed on
Sep 4, 1998
Sold by
Kelly Leanne M and Kelly Thomas S
Bought by
Vanvanchau Di Van
Create a Home Valuation Report for This Property
The Home Valuation Report is an in-depth analysis detailing your home's value as well as a comparison with similar homes in the area
Home Values in the Area
Average Home Value in this Area
Purchase History
| Date | Buyer | Sale Price | Title Company |
|---|---|---|---|
| Sfr Ii Borrower 2021-3 Llc | $500 | Stewart Title | |
| Hpa Us1 Llc | $410,000 | Realtech Title Llc | |
| Braget Travis T | $270,000 | On Site Title Llc | |
| Pam Vim Llc | $238,000 | -- | |
| Vanvanchau Di Van | $160,000 | -- | |
| -- | $410,000 | -- |
Source: Public Records
Mortgage History
| Date | Status | Borrower | Loan Amount |
|---|---|---|---|
| Previous Owner | Braget Travis T | $216,000 |
Source: Public Records
Tax History Compared to Growth
Tax History
| Year | Tax Paid | Tax Assessment Tax Assessment Total Assessment is a certain percentage of the fair market value that is determined by local assessors to be the total taxable value of land and additions on the property. | Land | Improvement |
|---|---|---|---|---|
| 2025 | $4,912 | $435,100 | $152,000 | $283,100 |
| 2024 | $4,896 | $418,600 | $152,000 | $266,600 |
| 2023 | $4,264 | $416,700 | $152,000 | $264,700 |
| 2022 | $4,034 | $417,600 | $150,300 | $267,300 |
| 2021 | $3,858 | $343,600 | $125,300 | $218,300 |
| 2020 | $3,914 | $340,400 | $125,300 | $215,100 |
| 2019 | $3,870 | $323,100 | $119,300 | $203,800 |
| 2018 | $3,422 | $323,100 | $119,300 | $203,800 |
| 2017 | $3,538 | $281,400 | $103,700 | $177,700 |
| 2016 | $3,724 | $270,100 | $0 | $0 |
| 2015 | $3,384 | $272,300 | $0 | $0 |
| 2014 | $3,384 | $228,100 | $0 | $0 |
Source: Public Records
Map
Nearby Homes
- 7104 Pontiac Cir
- 1003 Pontiac Ln
- 7291 Pontiac Cir
- 760 Bighorn Dr
- 1042 Pontiac Ln
- 710 W Village Rd Unit 105
- 7639 Nicholas Way
- 7719 Nicholas Way
- 7406 Laredo Dr
- 601 Fox Hill Dr
- 834 Cree Dr
- 1000 Carver Beach Rd
- 6690 Nez Perce Dr
- 1350 Heather Ct
- 5523 Game Farm Lookout
- 6620 Horseshoe Curve
- 303 W 77th St
- 7602 Erie Ave
- 970 Pleasantview Rd
- 6491 Bretton Way
- 950 Saddlebrook Trail
- 960 Saddlebrook Trail
- 960 Saddlebrook Trail
- 930 Saddlebrook Pass
- 970 Saddlebrook Trail
- 970 Saddlebrook Trail
- 991 Saddlebrook Trail
- 920 Saddlebrook Pass
- 931 Butte Ct
- 921 Butte Ct
- 1001 Saddlebrook Trail
- 981 Saddlebrook Trail
- 980 Saddlebrook Curve
- 980 Saddlebrook Curve
- 911 Saddlebrook Pass
- 980 Saddlebrook Trail
- 980 Saddlebrook Trail
- 941 Butte Ct
- 910 Saddlebrook Pass
- 901 Saddlebrook Pass