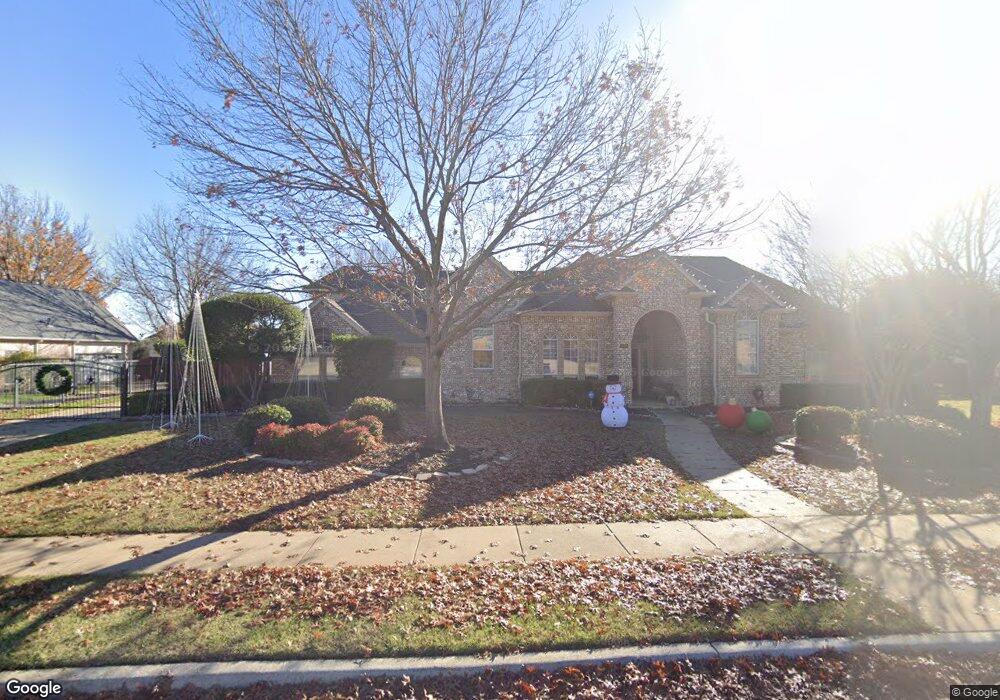
950 Southbend Trail Southlake, TX 76092
Estimated Value: $1,049,000 - $1,207,000
4
Beds
3
Baths
3,099
Sq Ft
$363/Sq Ft
Est. Value
About This Home
This home is located at 950 Southbend Trail, Southlake, TX 76092 and is currently estimated at $1,125,698, approximately $363 per square foot. 950 Southbend Trail is a home located in Tarrant County with nearby schools including Walnut Grove Elementary School, Don T. Durham Intermediate School, and Carroll Middle School.
Ownership History
Date
Name
Owned For
Owner Type
Purchase Details
Closed on
Apr 18, 2024
Sold by
Werner Mark W and Werner Scarlet A
Bought by
Tmg Lonestar Living Trust
Current Estimated Value
Purchase Details
Closed on
Jun 4, 1999
Sold by
Gotay Jose R and Gotay Milagros
Bought by
Werner Mark W and Werner Scarlet A
Home Financials for this Owner
Home Financials are based on the most recent Mortgage that was taken out on this home.
Original Mortgage
$236,147
Interest Rate
6.92%
Purchase Details
Closed on
Sep 26, 1996
Sold by
Calais Construction Inc
Bought by
Messing Mark and Messing Terri
Home Financials for this Owner
Home Financials are based on the most recent Mortgage that was taken out on this home.
Original Mortgage
$386,800
Interest Rate
7.96%
Create a Home Valuation Report for This Property
The Home Valuation Report is an in-depth analysis detailing your home's value as well as a comparison with similar homes in the area
Home Values in the Area
Average Home Value in this Area
Purchase History
| Date | Buyer | Sale Price | Title Company |
|---|---|---|---|
| Tmg Lonestar Living Trust | -- | None Listed On Document | |
| Werner Mark W | -- | Commonwealth Land Title | |
| Messing Mark | -- | Commonwealth Land Title |
Source: Public Records
Mortgage History
| Date | Status | Borrower | Loan Amount |
|---|---|---|---|
| Previous Owner | Werner Mark W | $236,147 | |
| Previous Owner | Messing Mark | $386,800 |
Source: Public Records
Tax History Compared to Growth
Tax History
| Year | Tax Paid | Tax Assessment Tax Assessment Total Assessment is a certain percentage of the fair market value that is determined by local assessors to be the total taxable value of land and additions on the property. | Land | Improvement |
|---|---|---|---|---|
| 2025 | $11,570 | $766,223 | $344,550 | $421,673 |
| 2024 | $11,570 | $946,062 | $344,550 | $601,512 |
| 2023 | $12,875 | $986,943 | $344,550 | $642,393 |
| 2022 | $13,854 | $642,149 | $229,700 | $412,449 |
| 2021 | $14,641 | $642,149 | $229,700 | $412,449 |
| 2020 | $13,561 | $589,971 | $206,730 | $383,241 |
| 2019 | $14,166 | $585,000 | $150,000 | $435,000 |
| 2018 | $12,646 | $557,033 | $150,000 | $407,033 |
| 2017 | $12,626 | $573,294 | $150,000 | $423,294 |
| 2016 | $11,479 | $489,714 | $150,000 | $339,714 |
| 2015 | $10,135 | $421,000 | $40,000 | $381,000 |
| 2014 | $10,135 | $421,000 | $40,000 | $381,000 |
Source: Public Records
Map
Nearby Homes
- 806 Ownby Ln
- 807 Cross Ln
- 1032 Rosavine Dr
- 1028 Rosavine Dr
- 1017 Rosavine Dr
- 1004 Rosavine Dr
- 1020 Rosavine Dr
- 1012 Rosavine Dr
- 1024 Rosavine Dr
- 1005 Rosavine Dr
- 1016 Rosavine Dr
- 1008 Rosavine Dr
- 350 Central Ave Unit 202
- 350 Central Ave Unit 503
- 350 Central Ave Unit 201
- 350 Central Ave Unit 307
- 350 Central Ave Unit 310
- 2300 Highway 114 Rd
- 231 Park Ridge Blvd
- 1577 Main St
- 970 Southbend Trail
- 920 Southbend Trail
- 955 Oasis Ct
- 975 Oasis Ct
- 955 Southbend Trail
- 925 Oasis Ct
- 925 Southbend Trail
- 975 Southbend Trail
- 1000 Southbend Trail
- 1025 Oasis Ct
- 915 Oasis Ct
- 525 Southview Trail
- 950 Southcrest Ct
- 950 Oasis Ct
- 970 Oasis Ct
- 970 Southcrest Ct
- 505 Southbend Trail
- 920 Oasis Ct
- 920 Southcrest Ct
- 555 Southview Trail