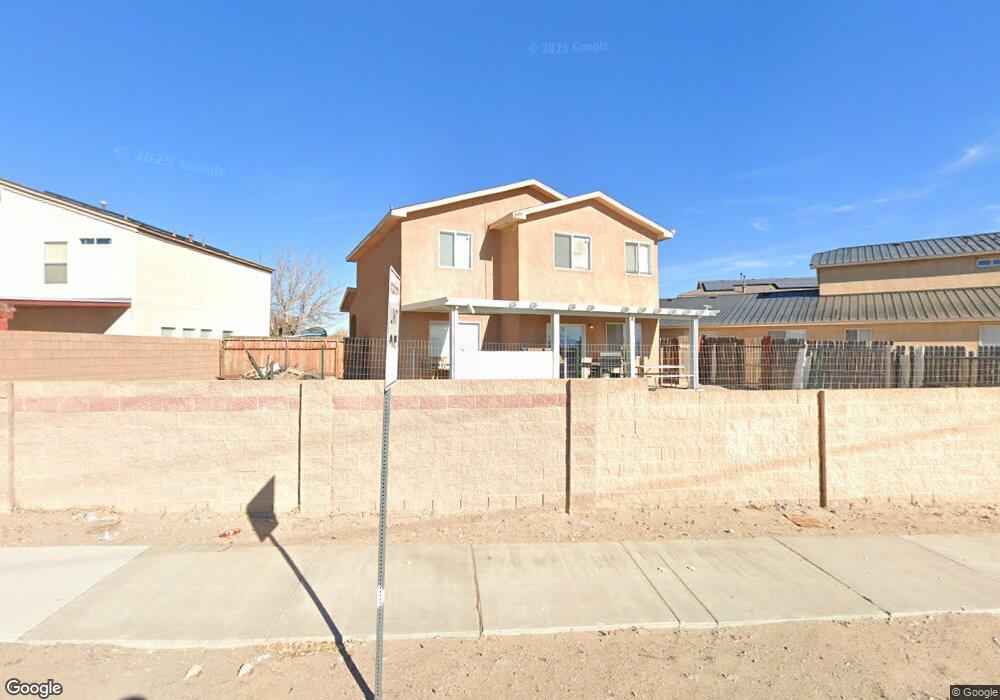
9504 Weems Ave SW Unit 3 Albuquerque, NM 87121
Southwest Heights NeighborhoodEstimated Value: $305,000 - $328,000
4
Beds
3
Baths
2,168
Sq Ft
$146/Sq Ft
Est. Value
About This Home
This home is located at 9504 Weems Ave SW Unit 3, Albuquerque, NM 87121 and is currently estimated at $316,679, approximately $146 per square foot. 9504 Weems Ave SW Unit 3 is a home located in Bernalillo County with nearby schools including Helen Cordero Primary School, Edward Gonzales Elementary School, and Jimmy Carter Middle School.
Ownership History
Date
Name
Owned For
Owner Type
Purchase Details
Closed on
May 5, 2017
Sold by
Wells Fargo Bank Na
Bought by
Montoya Anthony P
Current Estimated Value
Purchase Details
Closed on
Aug 25, 2016
Sold by
Ball James Stephen
Bought by
Wells Fargo Bank N A
Purchase Details
Closed on
Jun 8, 2006
Sold by
Wells Michael S and Wells Kristy Lynn
Bought by
Ball James Stephe
Home Financials for this Owner
Home Financials are based on the most recent Mortgage that was taken out on this home.
Original Mortgage
$137,600
Interest Rate
7.5%
Mortgage Type
Negative Amortization
Purchase Details
Closed on
Feb 28, 2002
Sold by
Fuller Homes Inc
Bought by
Hoffmann Emmanuel and Hoffman Ruby I
Home Financials for this Owner
Home Financials are based on the most recent Mortgage that was taken out on this home.
Original Mortgage
$133,472
Interest Rate
6.81%
Mortgage Type
FHA
Create a Home Valuation Report for This Property
The Home Valuation Report is an in-depth analysis detailing your home's value as well as a comparison with similar homes in the area
Home Values in the Area
Average Home Value in this Area
Purchase History
| Date | Buyer | Sale Price | Title Company |
|---|---|---|---|
| Montoya Anthony P | -- | None Available | |
| Wells Fargo Bank N A | -- | None Available | |
| Ball James Stephe | -- | First American Title Ins Co | |
| Hoffmann Emmanuel | -- | Fidelity National Title Ins |
Source: Public Records
Mortgage History
| Date | Status | Borrower | Loan Amount |
|---|---|---|---|
| Previous Owner | Ball James Stephe | $137,600 | |
| Previous Owner | Hoffmann Emmanuel | $133,472 |
Source: Public Records
Tax History Compared to Growth
Tax History
| Year | Tax Paid | Tax Assessment Tax Assessment Total Assessment is a certain percentage of the fair market value that is determined by local assessors to be the total taxable value of land and additions on the property. | Land | Improvement |
|---|---|---|---|---|
| 2024 | $2,404 | $56,982 | $11,629 | $45,353 |
| 2023 | $2,364 | $55,322 | $11,290 | $44,032 |
| 2022 | $2,285 | $53,711 | $10,961 | $42,750 |
| 2021 | $2,208 | $52,147 | $10,642 | $41,505 |
| 2020 | $2,172 | $50,628 | $10,332 | $40,296 |
| 2019 | $2,191 | $51,095 | $10,332 | $40,763 |
| 2018 | $2,177 | $51,095 | $10,332 | $40,763 |
| 2017 | $2,094 | $51,095 | $10,332 | $40,763 |
| 2016 | $1,871 | $43,976 | $10,642 | $33,334 |
| 2015 | $42,695 | $42,695 | $10,332 | $32,363 |
| 2014 | $1,813 | $42,695 | $10,332 | $32,363 |
| 2013 | -- | $50,991 | $4,180 | $46,811 |
Source: Public Records
Map
Nearby Homes
- 615 Avanti St SW
- 537 Sky Tower St SW
- 9608 Water Stone Rd SW
- 9900 Ladder Ranch Ln SW
- 9931 Hideout Ln SW
- 9736 Westbound Ave SW
- 9915 King Ranch Ln SW
- 10000 Bridle Falls Ave SW
- 632 Foyt Dr SW
- 700 Lone Pine Dr SW
- 805 Malachite Dr SW
- 0 Sage & 90th St SW Unit 1083191
- 8930 Thor Rd SW
- 9409 Desert Pine Ave SW
- 8523 Vista Serena Ln SW
- 8700 Thor Rd SW
- 519 Fenwick Place SW
- 8709 Odin Rd SW
- 10316 Andalusian Ave SW
- 9504 Sage Ranch Ct
- 9504 Weems Ave SW
- 9508 Weems Ave SW
- 9500 Weems Ave SW
- 9512 Weems Ave SW Unit 3
- 560 Dean Dr SW
- 556 Dean Dr SW
- 9516 Weems Ave SW Unit 3
- 552 Dean Dr SW
- 548 Dean Dr SW
- 547 Dean Dr SW
- 9600 Weems Ave SW
- 583 94th St SW
- 575 94th St SW
- 543 Dean Dr SW
- 571 94th St SW
- 544 Dean Dr SW
- 9604 Weems Ave SW
- 579 94th St SW
- 9505 Casitas Ct SW
- 9501 Casitas Ct SW