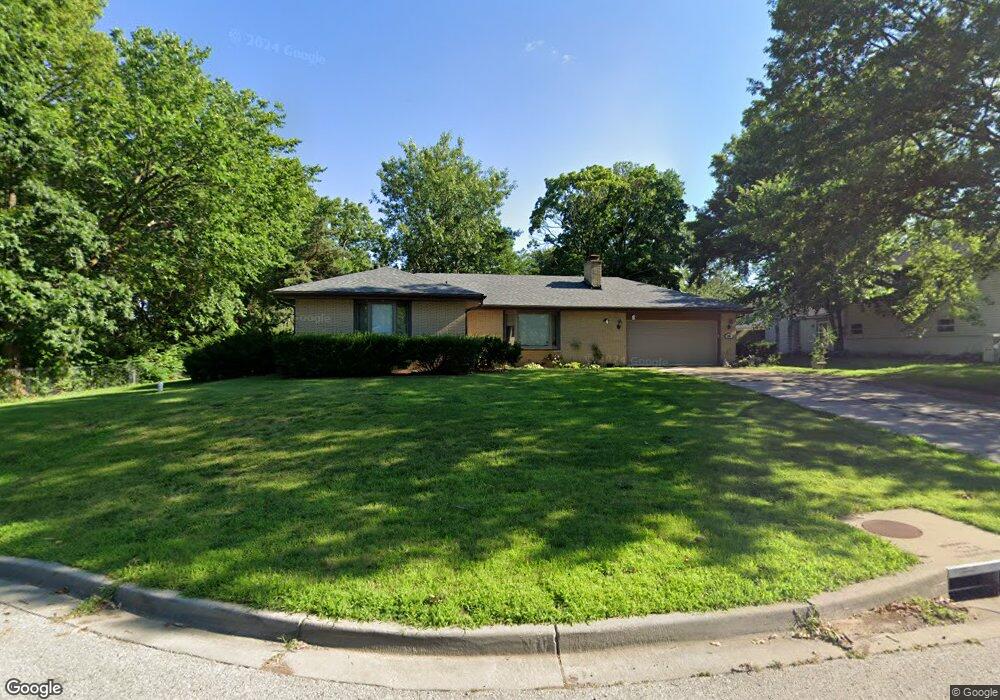
9505 W 56th St Shawnee, KS 66203
Estimated Value: $333,000 - $363,000
3
Beds
2
Baths
1,504
Sq Ft
$230/Sq Ft
Est. Value
About This Home
This home is located at 9505 W 56th St, Shawnee, KS 66203 and is currently estimated at $345,330, approximately $229 per square foot. 9505 W 56th St is a home located in Johnson County with nearby schools including Merriam Park Elementary School, Hocker Grove Middle School, and Shawnee Mission North High School.
Ownership History
Date
Name
Owned For
Owner Type
Purchase Details
Closed on
Nov 17, 2021
Sold by
Schmidt Megan R and Schmidt John C
Bought by
Schmidt Megan R and Schmidt John C
Current Estimated Value
Home Financials for this Owner
Home Financials are based on the most recent Mortgage that was taken out on this home.
Original Mortgage
$200,000
Outstanding Balance
$182,854
Interest Rate
2.98%
Mortgage Type
New Conventional
Estimated Equity
$162,476
Purchase Details
Closed on
May 25, 2016
Sold by
Sambol Richard L
Bought by
Schmidt Megan R and Schmidt Kathleen A
Home Financials for this Owner
Home Financials are based on the most recent Mortgage that was taken out on this home.
Original Mortgage
$170,946
Interest Rate
3.37%
Mortgage Type
FHA
Purchase Details
Closed on
Jul 18, 2007
Sold by
Sambol Richard L and Sambol Constance M
Bought by
Sambol Richard L and Richard L Sambol Living Trust
Create a Home Valuation Report for This Property
The Home Valuation Report is an in-depth analysis detailing your home's value as well as a comparison with similar homes in the area
Home Values in the Area
Average Home Value in this Area
Purchase History
| Date | Buyer | Sale Price | Title Company |
|---|---|---|---|
| Schmidt Megan R | -- | Alpha Title Guaranty Inc | |
| Schmidt Megan R | -- | None Available | |
| Sambol Richard L | -- | None Available |
Source: Public Records
Mortgage History
| Date | Status | Borrower | Loan Amount |
|---|---|---|---|
| Open | Schmidt Megan R | $200,000 | |
| Closed | Schmidt Megan R | $170,946 |
Source: Public Records
Tax History Compared to Growth
Tax History
| Year | Tax Paid | Tax Assessment Tax Assessment Total Assessment is a certain percentage of the fair market value that is determined by local assessors to be the total taxable value of land and additions on the property. | Land | Improvement |
|---|---|---|---|---|
| 2024 | $3,815 | $35,248 | $6,407 | $28,841 |
| 2023 | $3,673 | $34,523 | $5,342 | $29,181 |
| 2022 | $3,518 | $31,844 | $5,342 | $26,502 |
| 2021 | $3,518 | $26,450 | $4,853 | $21,597 |
| 2020 | $2,778 | $23,897 | $4,413 | $19,484 |
| 2019 | $2,832 | $24,345 | $3,836 | $20,509 |
| 2018 | $2,604 | $22,310 | $3,490 | $18,820 |
| 2017 | $2,380 | $20,021 | $3,490 | $16,531 |
| 2016 | $2,099 | $17,572 | $3,490 | $14,082 |
| 2015 | $1,978 | $16,686 | $3,490 | $13,196 |
| 2013 | -- | $16,295 | $3,490 | $12,805 |
Source: Public Records
Map
Nearby Homes
- 5517 Hayes St
- 9719 W 53rd St
- 5220 Hayes St
- 8613 W 54th Terrace
- 10116 W 52nd Terrace
- 9328 W 51st St
- The Fleetwood Plan at Bristol Highlands - The Villas
- The Kirkwood Plan at Bristol Highlands - The Villas
- The Rockwood Plan at Bristol Highlands - The Villas
- 5003 Knox Ave
- 8510 W 61st St
- 11002 W 55th Terrace
- 9012 W 49th St
- 9201 W 48th Terrace
- 0 W 49th St
- 10511 W 49th Place
- 6213 Terrydale St
- 5232 Lowell St
- 5308 Mcanany Dr
- 4820 Hadley St
- 9513 W 56th St
- 9504 W 56th Terrace
- 9500 W 56th St
- 9508 W 56th Terrace
- 9504 W 56th St
- 9521 W 56th St
- 9512 W 56th St
- 9500 W 56th Terrace
- 9512 W 56th Terrace
- 9520 W 56th St
- 9604 W 56th Terrace
- 5612 Hayes St
- 9603 W 56th St
- 5604 Hayes St
- 5548 Hayes St
- 5540 Hayes St
- 9503 W 56th Terrace
- 9602 W 56th St
- 9509 W 56th Terrace
- 5628 Hayes St