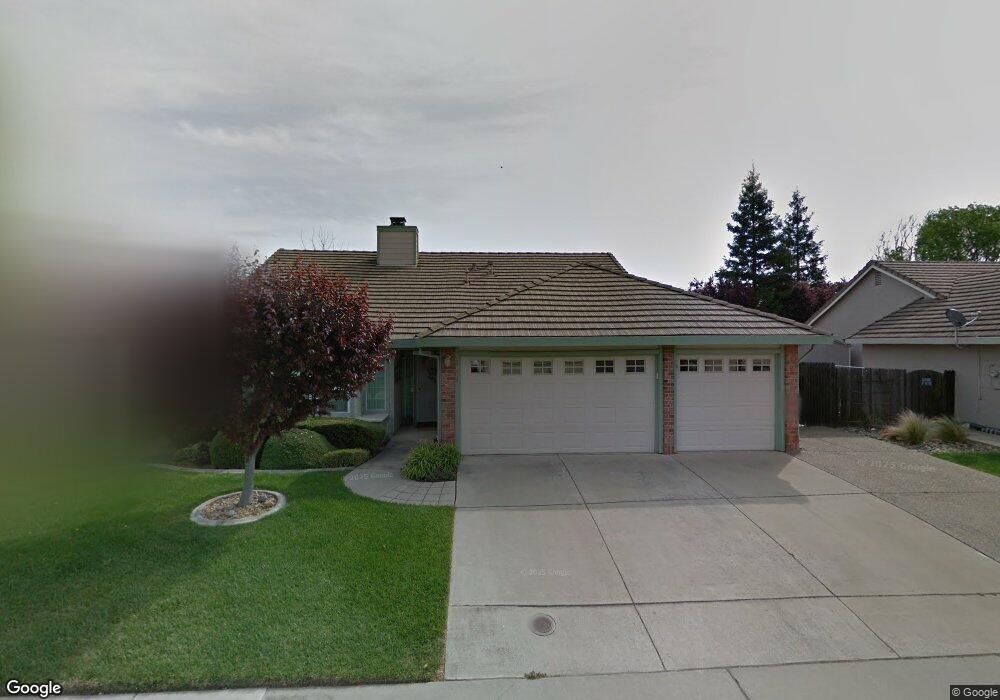
9509 Royston Way Elk Grove, CA 95758
North West Elk Grove NeighborhoodEstimated Value: $560,954 - $604,000
3
Beds
2
Baths
1,590
Sq Ft
$363/Sq Ft
Est. Value
About This Home
This home is located at 9509 Royston Way, Elk Grove, CA 95758 and is currently estimated at $576,489, approximately $362 per square foot. 9509 Royston Way is a home located in Sacramento County with nearby schools including Elitha Donner Elementary School, Harriet G. Eddy Middle School, and Laguna Creek High School.
Ownership History
Date
Name
Owned For
Owner Type
Purchase Details
Closed on
Jun 25, 2014
Sold by
Hedlund Mark L and Hedlund Rodney D
Bought by
Whitehead Andrew J and Whitehead Krista Alina
Current Estimated Value
Home Financials for this Owner
Home Financials are based on the most recent Mortgage that was taken out on this home.
Original Mortgage
$208,000
Interest Rate
4.13%
Mortgage Type
New Conventional
Purchase Details
Closed on
Jun 7, 2014
Sold by
Hedlund Mark L and Hedlund Rodney D
Bought by
Hedlund Mark L and Hedlund Rodney D
Home Financials for this Owner
Home Financials are based on the most recent Mortgage that was taken out on this home.
Original Mortgage
$208,000
Interest Rate
4.13%
Mortgage Type
New Conventional
Purchase Details
Closed on
Jan 29, 2013
Sold by
Hedlund Marina S and Hedlund Family Trust
Bought by
Hedlund Marina S and Hedlund Family Trust
Purchase Details
Closed on
Mar 7, 1994
Sold by
M J Brock & Sons Inc
Bought by
Hudlund Darold W and Hedlund Marina S
Create a Home Valuation Report for This Property
The Home Valuation Report is an in-depth analysis detailing your home's value as well as a comparison with similar homes in the area
Home Values in the Area
Average Home Value in this Area
Purchase History
| Date | Buyer | Sale Price | Title Company |
|---|---|---|---|
| Whitehead Andrew J | $260,000 | Fidelity National Title Co | |
| Hedlund Mark L | -- | None Available | |
| Hedlund Marina S | -- | None Available | |
| Hudlund Darold W | $150,500 | Stewart Title |
Source: Public Records
Mortgage History
| Date | Status | Borrower | Loan Amount |
|---|---|---|---|
| Closed | Whitehead Andrew J | $208,000 |
Source: Public Records
Tax History Compared to Growth
Tax History
| Year | Tax Paid | Tax Assessment Tax Assessment Total Assessment is a certain percentage of the fair market value that is determined by local assessors to be the total taxable value of land and additions on the property. | Land | Improvement |
|---|---|---|---|---|
| 2025 | $3,351 | $283,931 | $80,286 | $203,645 |
| 2024 | $3,351 | $278,364 | $78,712 | $199,652 |
| 2023 | $3,264 | $272,907 | $77,169 | $195,738 |
| 2022 | $3,195 | $267,556 | $75,656 | $191,900 |
| 2021 | $3,138 | $262,311 | $74,173 | $188,138 |
| 2020 | $3,094 | $259,622 | $73,413 | $186,209 |
| 2019 | $3,034 | $254,532 | $71,974 | $182,558 |
| 2018 | $2,952 | $249,542 | $70,563 | $178,979 |
| 2017 | $2,898 | $244,650 | $69,180 | $175,470 |
| 2016 | $2,757 | $239,854 | $67,824 | $172,030 |
| 2015 | $2,707 | $236,252 | $66,806 | $169,446 |
| 2014 | $2,429 | $208,374 | $62,383 | $145,991 |
Source: Public Records
Map
Nearby Homes
- 9510 Village Tree Dr
- 9550 Village Tree Dr
- 7905 Baldur Ct
- 8200 Burloak Way
- 7801 Melfort Way
- 9578 Dominion Wood Ln
- 8464 Crystal Walk Cir
- 9357 Hoyleton Way
- 8288 Primoak Way
- 8397 Crystal Walk Cir
- 9508 Delburns Ct
- 8286 Caribou Peak Way
- 9578 Dunkerrin Way
- 7300 Saltgrass Way
- 9733 Enviro Way
- 9728 Philta Way
- 8125 Genex Way
- 7109 Ballygar Way
- 9364 Ivydale Cir
- 9252 Faraway Place
- 9513 Royston Way
- 9505 Royston Way
- 9518 Village Tree Dr
- 9514 Village Tree Dr
- 9522 Village Tree Dr
- 9526 Village Tree Dr
- 9517 Royston Way
- 9510 Royston Way
- 9501 Royston Way
- 9524 Wadena Way
- 9506 Village Tree Dr
- 9530 Village Tree Dr
- 9516 Royston Way
- 9502 Village Tree Dr
- 9534 Village Tree Dr
- 9521 Royston Way
- 9536 Wadena Way
- 9520 Wadena Way
- 9524 Royston Way
- 9515 Village Tree Dr