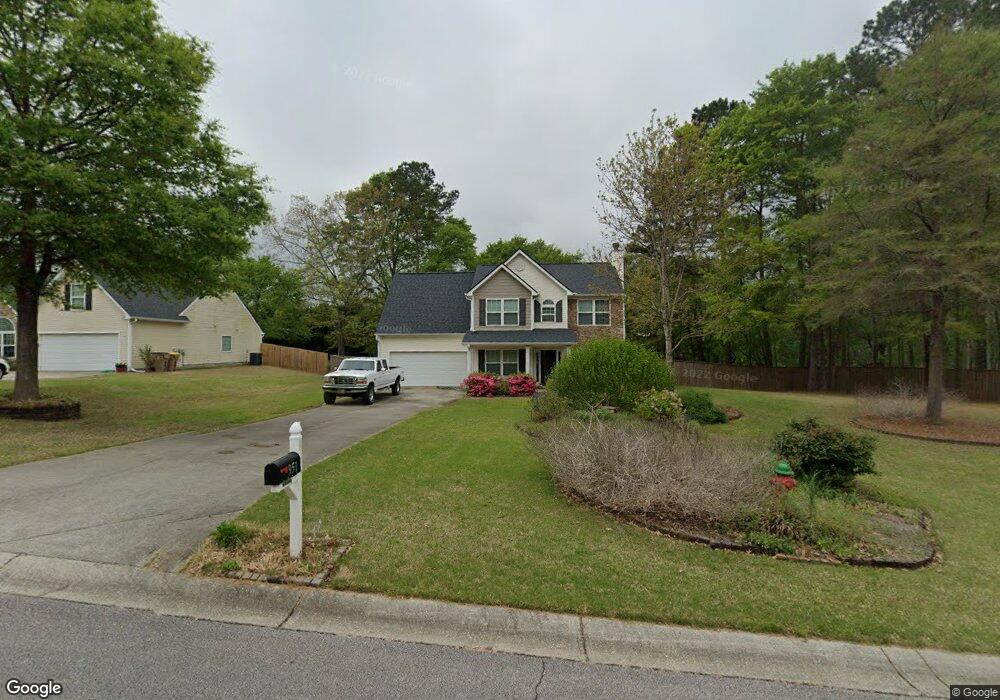
951 Downing Dr Bethlehem, GA 30620
Estimated Value: $344,000 - $379,000
3
Beds
3
Baths
2,009
Sq Ft
$177/Sq Ft
Est. Value
About This Home
This home is located at 951 Downing Dr, Bethlehem, GA 30620 and is currently estimated at $356,489, approximately $177 per square foot. 951 Downing Dr is a home located in Barrow County with nearby schools including Yargo Elementary School, Haymon-Morris Middle School, and Apalachee High School.
Ownership History
Date
Name
Owned For
Owner Type
Purchase Details
Closed on
Nov 25, 2009
Sold by
First Frankli Trust 2006-Ff8
Bought by
Smith David
Current Estimated Value
Home Financials for this Owner
Home Financials are based on the most recent Mortgage that was taken out on this home.
Original Mortgage
$118,265
Outstanding Balance
$77,455
Interest Rate
4.98%
Mortgage Type
New Conventional
Estimated Equity
$279,034
Purchase Details
Closed on
Jun 2, 2009
Sold by
Her Ching J
Bought by
First Franklin Trust 2006-Ff8
Purchase Details
Closed on
Apr 28, 2006
Sold by
Crown Pk Hms Of Cambridge Llc
Bought by
Her Ching J and Yang Mary
Home Financials for this Owner
Home Financials are based on the most recent Mortgage that was taken out on this home.
Original Mortgage
$33,180
Interest Rate
6%
Mortgage Type
New Conventional
Purchase Details
Closed on
Jun 11, 2004
Sold by
Millstone Development Group In
Bought by
Crown Park Homes At Cambridge Llc
Purchase Details
Closed on
Apr 1, 2004
Bought by
Millstone Development Group Inc
Create a Home Valuation Report for This Property
The Home Valuation Report is an in-depth analysis detailing your home's value as well as a comparison with similar homes in the area
Home Values in the Area
Average Home Value in this Area
Purchase History
| Date | Buyer | Sale Price | Title Company |
|---|---|---|---|
| Smith David | $116,000 | -- | |
| First Franklin Trust 2006-Ff8 | $116,250 | -- | |
| Deutsche Banknational Trust Co | -- | -- | |
| Her Ching J | $165,900 | -- | |
| Crown Park Homes At Cambridge Llc | $38,500 | -- | |
| Millstone Development Group Inc | -- | -- |
Source: Public Records
Mortgage History
| Date | Status | Borrower | Loan Amount |
|---|---|---|---|
| Open | Smith David | $118,265 | |
| Previous Owner | Her Ching J | $33,180 |
Source: Public Records
Tax History Compared to Growth
Tax History
| Year | Tax Paid | Tax Assessment Tax Assessment Total Assessment is a certain percentage of the fair market value that is determined by local assessors to be the total taxable value of land and additions on the property. | Land | Improvement |
|---|---|---|---|---|
| 2024 | $3,150 | $127,970 | $28,000 | $99,970 |
| 2023 | $2,564 | $120,965 | $28,000 | $92,965 |
| 2022 | $2,764 | $94,105 | $22,400 | $71,705 |
| 2021 | $2,443 | $78,067 | $18,000 | $60,067 |
| 2020 | $2,299 | $73,095 | $18,000 | $55,095 |
| 2019 | $2,339 | $73,095 | $18,000 | $55,095 |
| 2018 | $2,205 | $69,446 | $14,200 | $55,246 |
| 2017 | $1,707 | $58,635 | $14,200 | $44,435 |
| 2016 | $1,639 | $51,324 | $14,200 | $37,124 |
| 2015 | $1,659 | $51,728 | $14,200 | $37,528 |
| 2014 | $1,526 | $45,771 | $7,840 | $37,931 |
| 2013 | -- | $43,349 | $7,840 | $35,509 |
Source: Public Records
Map
Nearby Homes
- 1024 Lyndhurst Ln
- 1111 Otis Dr
- 1164 Otis Dr
- 1129 Loganville Hwy
- 704 Newnham Walk
- 209 Angie Way
- 738 Worth Ct
- 724 Westbury Dr
- 303 Ron Dr
- 720 Westbury Ct
- 2018 Ben Johnson Rd
- 713 Carl Bethlehem Rd
- 934 Beaver Hill Dr
- 73 Silverleaf Trail
- 64 Silverleaf Trail
- 268 Silverleaf Trail
- 280 Silverleaf Trail
- 1529 Blakewood Trail
- The Barnes Plan at River Meadows
- The Paisley Plan at River Meadows
- 949 Downing Dr Unit 96
- 949 Downing Dr
- 954 Downing Dr
- 505 Bentley Cir
- 950 Downing Dr
- 957 Downing Dr
- 1139 Otis Dr
- 1139 Otis Dr
- 1139 Otis Dr Unit 92
- 503 Bentley Cir
- 507 Bentley Cir Unit 1
- 507 Bentley Cir
- 956 Downing Dr
- 1108 Nantucket Way
- 1222 Lyndhurst Ln
- 82 Lyndhurst Dr
- 66 Lyndhurst Dr
- 211 Lyndhurst Dr
- 214 Lyndhurst Dr
- 1159 Nantucket Way