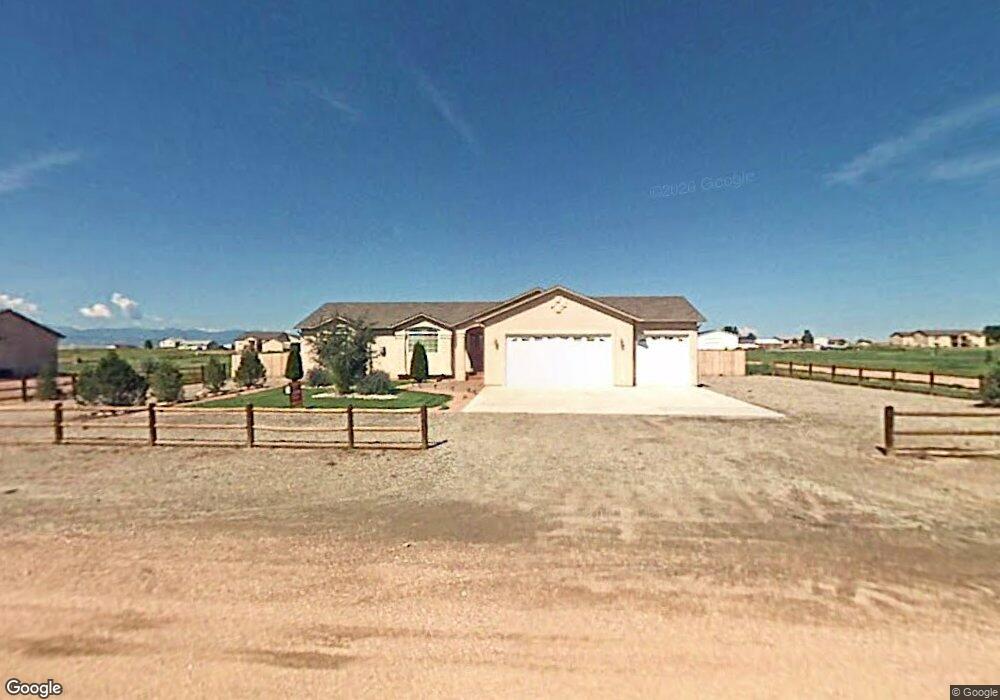
951 S Cienaga Dr Pueblo, CO 81007
Estimated Value: $412,000 - $640,000
3
Beds
1
Bath
1,646
Sq Ft
$295/Sq Ft
Est. Value
About This Home
This home is located at 951 S Cienaga Dr, Pueblo, CO 81007 and is currently estimated at $485,036, approximately $294 per square foot. 951 S Cienaga Dr is a home located in Pueblo County with nearby schools including Sierra Vista Elementary School, Sky View Middle School, and Pueblo West High School.
Ownership History
Date
Name
Owned For
Owner Type
Purchase Details
Closed on
Mar 13, 2008
Sold by
Tolar Scott
Bought by
Schweitzer Gary M and Schweitzer Margaret C
Current Estimated Value
Home Financials for this Owner
Home Financials are based on the most recent Mortgage that was taken out on this home.
Original Mortgage
$75,000
Interest Rate
5.24%
Mortgage Type
Purchase Money Mortgage
Purchase Details
Closed on
Jul 16, 2004
Sold by
Chad P Pulsifer Constr Inc
Bought by
Tolar Scott
Purchase Details
Closed on
Aug 28, 2003
Sold by
Millison Stephen P + Ilona F
Bought by
Chad P Pulsifer Constr Inc
Purchase Details
Closed on
Sep 10, 2001
Sold by
Matzl Gary Alan
Bought by
Millison Stephen P + Ilona F
Purchase Details
Closed on
Jun 12, 1990
Sold by
Matzl Robert + Eleanor
Bought by
Matzl Gary Alan
Purchase Details
Closed on
Jan 6, 1984
Sold by
Lawyers Title Of Pueblo Tr
Bought by
Matzl Robert + Eleanor
Create a Home Valuation Report for This Property
The Home Valuation Report is an in-depth analysis detailing your home's value as well as a comparison with similar homes in the area
Home Values in the Area
Average Home Value in this Area
Purchase History
| Date | Buyer | Sale Price | Title Company |
|---|---|---|---|
| Schweitzer Gary M | $237,000 | Land Title Guarantee Company | |
| Tolar Scott | $219,400 | -- | |
| Chad P Pulsifer Constr Inc | $15,000 | -- | |
| Millison Stephen P + Ilona F | $13,000 | -- | |
| Matzl Gary Alan | $1,000 | -- | |
| Matzl Robert + Eleanor | $10,000 | -- |
Source: Public Records
Mortgage History
| Date | Status | Borrower | Loan Amount |
|---|---|---|---|
| Closed | Schweitzer Gary M | $75,000 |
Source: Public Records
Tax History Compared to Growth
Tax History
| Year | Tax Paid | Tax Assessment Tax Assessment Total Assessment is a certain percentage of the fair market value that is determined by local assessors to be the total taxable value of land and additions on the property. | Land | Improvement |
|---|---|---|---|---|
| 2024 | $1,777 | $24,310 | -- | -- |
| 2023 | $1,799 | $28,000 | $4,460 | $23,540 |
| 2022 | $1,677 | $23,567 | $2,750 | $20,817 |
| 2021 | $1,719 | $24,250 | $2,830 | $21,420 |
| 2020 | $1,193 | $23,070 | $2,830 | $20,240 |
| 2019 | $1,189 | $18,959 | $1,108 | $17,851 |
| 2018 | $1,751 | $17,511 | $864 | $16,647 |
| 2017 | $1,753 | $17,511 | $864 | $16,647 |
| 2016 | $1,690 | $16,913 | $1,433 | $15,480 |
| 2015 | $1,676 | $16,913 | $1,433 | $15,480 |
| 2014 | $1,587 | $16,006 | $1,592 | $14,414 |
Source: Public Records
Map
Nearby Homes
- 1071 S Mcculloch Way
- 886 S Camino de Bravo
- 822 S Espanola Dr
- 660 W Capistrano Ave
- 1003 S Quantico Dr
- 712 W Mcculloch Blvd
- 1144 S Mcculloch Blvd W
- 846 S Bellflower Dr Unit 848
- 625 S Vallejo Dr
- 437 W Pepper Tree Way
- 773 S Bellflower Dr
- 894 W Garcia Ct
- 977 S Harmony Dr Unit 979
- 977 S Harmony Dr Unit 977 & 979
- 351 W Hazelnut Way Unit 353
- 941 S Harmony Dr
- 523 W Hook Dr
- 349 W Buttercup Way
- 925 S Camino Santiago Dr
- 780 S Honeydew Dr
- 915 S Cienaga Dr
- 915 S Cienaga Dr Unit 10
- 963 S Cienaga Dr
- 950 S Cienaga Dr
- 939 S Cienaga Dr
- 975 S Cienaga Dr
- 962 S Cienaga Dr
- 691 W Espanola Dr
- 977 S Cienaga Dr
- 977 S Cienaga Dr Unit 11
- 926 S Cienaga Dr
- 974 S Cienaga Dr Unit 12
- 987 S Cienaga Dr
- 986 S Cienaga Dr Unit 13
- 962 S Bayonne Dr Unit 3
- 962 S Bayonne Dr
- 954 S Bayonne Dr
- 914 S Cienaga Dr
- 739 W Espanola Dr
- 970 S Bayonne Dr