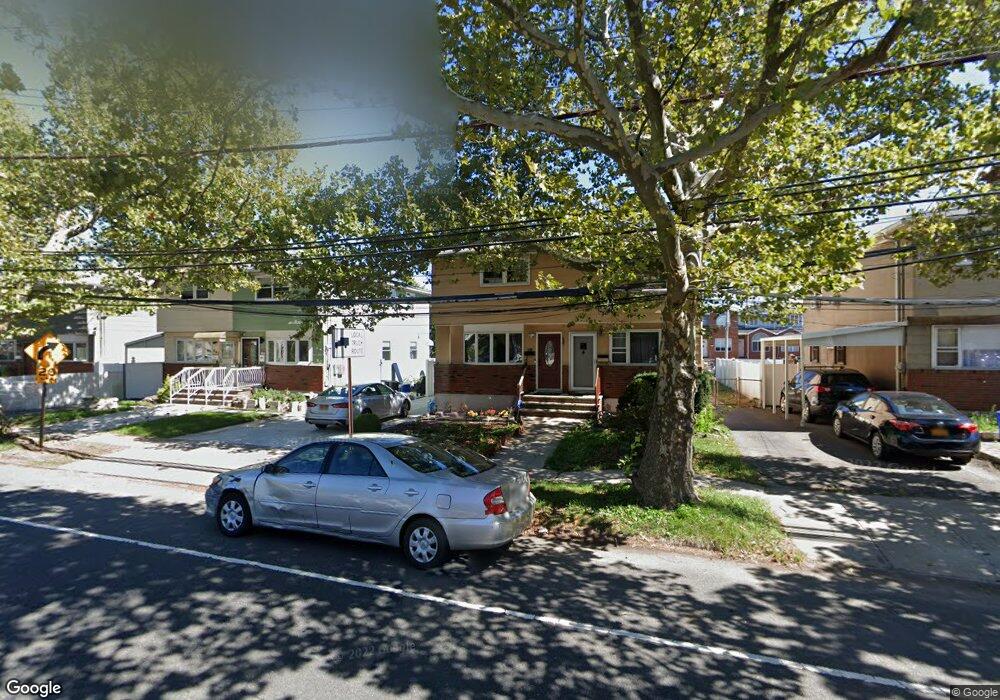
951 Targee St Staten Island, NY 10304
Concord NeighborhoodEstimated Value: $577,773 - $720,000
3
Beds
2
Baths
1,080
Sq Ft
$603/Sq Ft
Est. Value
About This Home
This home is located at 951 Targee St, Staten Island, NY 10304 and is currently estimated at $650,943, approximately $602 per square foot. 951 Targee St is a home located in Richmond County with nearby schools including P.S. 48 - William C. Wilcox, I.S. 49 Berta A Dreyfus, and New Dorp High School.
Ownership History
Date
Name
Owned For
Owner Type
Purchase Details
Closed on
Oct 29, 2002
Sold by
Belanger Charles
Bought by
Silmi Sausen
Current Estimated Value
Home Financials for this Owner
Home Financials are based on the most recent Mortgage that was taken out on this home.
Original Mortgage
$39,000
Interest Rate
6.18%
Mortgage Type
Stand Alone Second
Purchase Details
Closed on
Aug 16, 2001
Sold by
West Michael P and West Anne Marie
Bought by
Belanger Charles
Home Financials for this Owner
Home Financials are based on the most recent Mortgage that was taken out on this home.
Original Mortgage
$164,250
Interest Rate
8.5%
Purchase Details
Closed on
Nov 12, 1997
Sold by
Lombardo Christopher and Lombardo Lynn Ann
Bought by
West Michael P and West Anne Marie
Create a Home Valuation Report for This Property
The Home Valuation Report is an in-depth analysis detailing your home's value as well as a comparison with similar homes in the area
Home Values in the Area
Average Home Value in this Area
Purchase History
| Date | Buyer | Sale Price | Title Company |
|---|---|---|---|
| Silmi Sausen | $260,000 | -- | |
| Belanger Charles | $219,000 | Commonwealth Land Title Ins | |
| West Michael P | $145,000 | Commonwealth Land Title Ins |
Source: Public Records
Mortgage History
| Date | Status | Borrower | Loan Amount |
|---|---|---|---|
| Previous Owner | Silmi Sausen | $39,000 | |
| Previous Owner | Belanger Charles | $164,250 |
Source: Public Records
Tax History Compared to Growth
Tax History
| Year | Tax Paid | Tax Assessment Tax Assessment Total Assessment is a certain percentage of the fair market value that is determined by local assessors to be the total taxable value of land and additions on the property. | Land | Improvement |
|---|---|---|---|---|
| 2025 | $4,207 | $34,800 | $4,492 | $30,308 |
| 2024 | $4,219 | $34,680 | $4,253 | $30,427 |
| 2023 | $3,997 | $21,082 | $3,669 | $17,413 |
| 2022 | $3,922 | $31,860 | $6,600 | $25,260 |
| 2021 | $4,100 | $30,300 | $6,600 | $23,700 |
| 2020 | $3,882 | $29,520 | $6,600 | $22,920 |
| 2019 | $3,602 | $32,040 | $6,600 | $25,440 |
| 2018 | $3,284 | $17,568 | $3,857 | $13,711 |
| 2017 | $3,282 | $17,568 | $4,679 | $12,889 |
| 2016 | $3,176 | $17,435 | $5,283 | $12,152 |
| 2015 | $2,673 | $16,449 | $4,759 | $11,690 |
| 2014 | $2,673 | $15,518 | $5,099 | $10,419 |
Source: Public Records
Map
Nearby Homes
- 24 Roosevelt St
- 72 Alan Loop
- 456 Oder Ave
- 13 Wilson Terrace
- 31 Alan Loop Unit 65
- 164 Stonegate Dr
- 1890 Clove Rd
- 0 Douglas Rd
- 63 Gateway Dr Unit 172
- 1 Douglas Ct
- 76 Douglas Rd
- 6 Eltinge St
- 89 Columbus Ave
- 62 Columbus Ave
- 14 Eltinge St
- 4 Sheridan Ave
- 98 N Railroad Ave
- 751 Targee St
- 325 Oder Ave
- 22 Scranton St