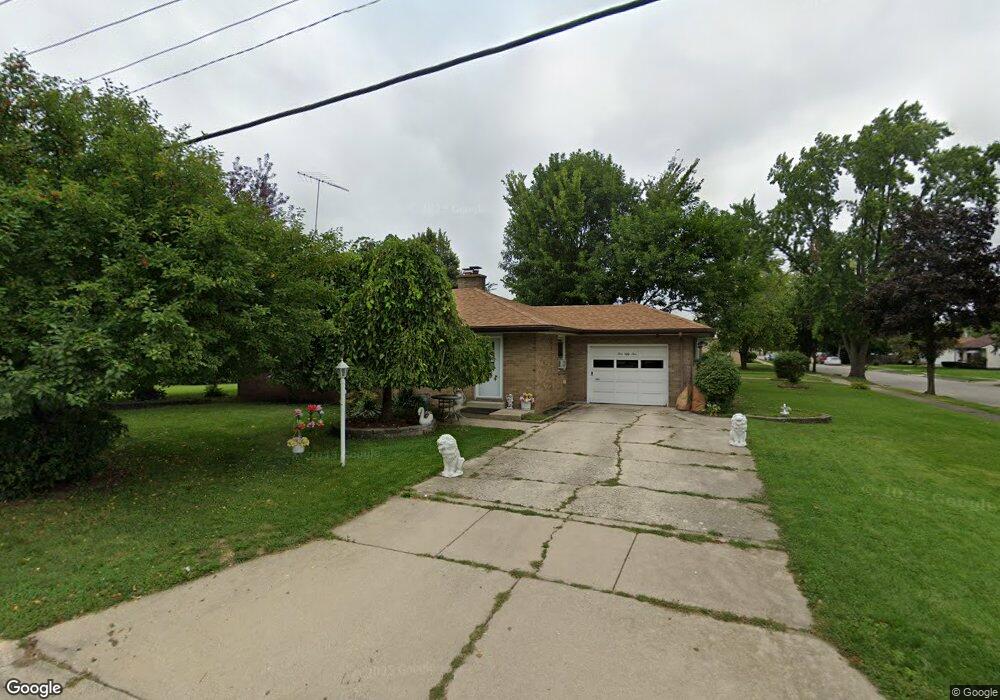
951 W Marion St Joliet, IL 60436
Reedwood NeighborhoodEstimated Value: $213,230 - $272,000
--
Bed
--
Bath
1,314
Sq Ft
$191/Sq Ft
Est. Value
About This Home
This home is located at 951 W Marion St, Joliet, IL 60436 and is currently estimated at $251,058, approximately $191 per square foot. 951 W Marion St is a home located in Will County with nearby schools including Lynne Thigpen Elementary School, Dirksen Junior High School, and Joliet Central High School.
Ownership History
Date
Name
Owned For
Owner Type
Purchase Details
Closed on
Dec 21, 2020
Sold by
Castillo Enriqueta
Bought by
Castillo David
Current Estimated Value
Home Financials for this Owner
Home Financials are based on the most recent Mortgage that was taken out on this home.
Original Mortgage
$121,963
Outstanding Balance
$104,820
Interest Rate
2.87%
Mortgage Type
FHA
Estimated Equity
$146,238
Purchase Details
Closed on
Dec 27, 2005
Sold by
Mascote Roberto and Mascote Martha L
Bought by
Castillo Enriqueta
Home Financials for this Owner
Home Financials are based on the most recent Mortgage that was taken out on this home.
Original Mortgage
$115,810
Interest Rate
6.34%
Mortgage Type
Fannie Mae Freddie Mac
Purchase Details
Closed on
Jan 30, 1995
Sold by
Garvey Joseph J and Garvey Virginia R
Bought by
Mascote Roberto and Mascote Martha L
Home Financials for this Owner
Home Financials are based on the most recent Mortgage that was taken out on this home.
Original Mortgage
$79,200
Interest Rate
9.28%
Create a Home Valuation Report for This Property
The Home Valuation Report is an in-depth analysis detailing your home's value as well as a comparison with similar homes in the area
Home Values in the Area
Average Home Value in this Area
Purchase History
| Date | Buyer | Sale Price | Title Company |
|---|---|---|---|
| Castillo David | -- | Snp Title Co | |
| Castillo Enriqueta | $156,500 | Fatic | |
| Mascote Roberto | $88,000 | Chicago Title Insurance Co |
Source: Public Records
Mortgage History
| Date | Status | Borrower | Loan Amount |
|---|---|---|---|
| Open | Castillo David | $121,963 | |
| Closed | Castillo Enriqueta | $115,810 | |
| Previous Owner | Mascote Roberto | $79,200 |
Source: Public Records
Tax History Compared to Growth
Tax History
| Year | Tax Paid | Tax Assessment Tax Assessment Total Assessment is a certain percentage of the fair market value that is determined by local assessors to be the total taxable value of land and additions on the property. | Land | Improvement |
|---|---|---|---|---|
| 2024 | $1,378 | $72,202 | $18,295 | $53,907 |
| 2023 | $1,378 | $64,151 | $16,255 | $47,896 |
| 2022 | $4,343 | $58,029 | $14,704 | $43,325 |
| 2021 | $2,016 | $54,197 | $13,733 | $40,464 |
| 2020 | $2,014 | $51,469 | $13,042 | $38,427 |
| 2019 | $2,061 | $47,834 | $12,121 | $35,713 |
| 2018 | $2,137 | $42,937 | $10,887 | $32,050 |
| 2017 | $2,216 | $39,037 | $9,898 | $29,139 |
| 2016 | $2,305 | $35,989 | $9,076 | $26,913 |
| 2015 | $3,085 | $32,600 | $8,550 | $24,050 |
| 2014 | $3,085 | $32,450 | $8,500 | $23,950 |
| 2013 | $3,085 | $35,616 | $9,432 | $26,184 |
Source: Public Records
Map
Nearby Homes
- 19 S William St
- 17 S William St
- 957 W Marion St
- 18 Salem Dr
- 914 W Marion St
- 956 W Marion St
- 907 W Marion St
- 16 Salem Dr
- 102 S William St
- 20 S William St
- 13 S William St
- 18 S William St
- 103 S William St
- 104 S William St
- 14 Salem Dr
- 16 S William St
- 11 S William St
- 908 W Marion St
- 106 S William St
- 14 S William St